Survey research and design in psychology/Lectures/Correlation
< Survey research and design in psychology < Lectures| |
This page is complete for 2016. |
Lecture 4: Correlation
| |
Resource type: this resource contains a lecture or lecture notes. |
This is the fourth lecture for the Survey research and design in psychology unit of study.

Outline
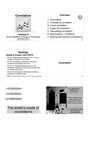
This lecture overviews non-parametric and parametric approaches to (bivariate) measures of association (dependence), i.e., correlational statistics and graphing. The lecture is accompanied by a computer-based tutorial.
This lecture explains:
- The purpose of correlation (what types of question(s) are we trying to answer?)
- Nature of covariation (what does it mean if two variables covary or “vary together”?)
- Correlational analyses
- Types of answers – What can we conclude?
- Types of correlation – Selecting appropriate correlations and graphs based on the variables' level of measurement
- Interpretation – of correlational relations and graphs
- Assumptions and Limitations
- Dealing with several correlations
The lecture resources include presentation slides, audio and video recordings, and additional notes.
Slides
- Lecture slides (Slideshare)
- 2016 handouts:
- Download 6 slides to a page:

- Download 3 slides to a page:

- Download 6 slides to a page:
Readings
- Howitt and Cramer (2011a):
- Chapter 06: Relationships between two or more variables: Diagrams and tables (pp. 59-67)
- Chapter 07: Correlation coefficients: Pearson correlation and Spearman’s rho (pp. 68-85)
- Chapter 10: Statistical significance for the correlation coefficient: A practical introduction to statistical inference (pp. 106-117)
- Chapter 14: Chi-square: Differences between samples of frequency data (pp. 152-170)
- Howitt and Cramer (2014a):
- Chapter 07: Relationships between two or more variables: Diagrams and tables (pp. 86-97
- Chapter 08: Correlation coefficients: Pearson correlation and Spearman’s rho (pp. 98-119)
- Chapter 09: Statistical significance for the correlation coefficient: A practical introduction to statistical inference (pp. 120-132)
- Chapter 15: Chi-square: Differences between samples of frequency data (pp. 196-217)
See also
- Descriptives & graphing (Previous lecture)
- Exploratory factor analysis (Next lecture)
- Correlation (Tutorial)
- Correlation
- Correlation quiz (Practice)
External links
- Relationships between two or more variables: Diagrams (Ch 9) Quiz (Practice) (Howitt & Cramer, 2014)
- Correlation co-efficients (Ch 10) Quiz (Practice) (Howitt & Cramer, 2014)
This article is issued from Wikiversity - version of the Thursday, March 10, 2016. The text is available under the Creative Commons Attribution/Share Alike but additional terms may apply for the media files.