Stars/Sun/Astronomy
< Stars < Sun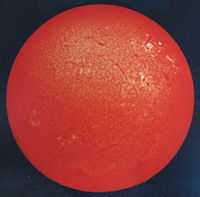
Sol passes overhead every day in most locations on the surface of the Earth.
The Sun moves across the sky during the day time only. An entity or two may be responsible for this.
Solar astronomy is the astronomy of the star, Sol, often called the Sun.
Sun
Def. "1.9891 x 1030 kg" is called the mass of the Sun.[1]
Astronomy
A nomy (Latin nomia) is a "system of laws governing or [the] sum of knowledge regarding a (specified) field."[2]
When any effort to acquire a system of laws or knowledge focusing on an astr, aster, or astro, that is, any natural body in the sky especially at night,[2] succeeds even in its smallest measurement, astronomy is the name of the effort and the result.
Meteors
"Sun-grazing comets almost never re-emerge, but their sublimative destruction near the sun has only recently been observed directly, while chromospheric impacts have not yet been seen, nor impact theory developed."[3] "[N]uclei are ... destroyed by ablation or explosion ... in the chromosphere, producing flare-like events with cometary abundance spectra."[3]
"The death of a comet at r ~ R⨀ has been seen directly only very recently (Schrijver et al 2011) using the SDO AIA XUV instrument. This recorded sublimative destruction of Comet C/2011 N3 as it crossed the solar disk very near periheloin q = 1.139Rʘ."[3]
"The phenomenon of flare induced sunquakes - waves in the photosphere - discovered by Kosovichev and Zharkova (1998) and now widely studied (e.g. Kosovichev 2006) should also result from the momentum impulse delivered by a cometary impact."[3]
"Coronal clouds, type IIIg, form in space above a spot area and rain streamers upon it."[4]
The solar wind originates through the polar coronal holes.
Cosmic rays
The surface of the Sun has not been detected with cosmic rays.
"[T]he relative abundances of solar cosmic rays reflect those of the solar photosphere for multicharged nuclei with approximately the same nuclear charge-to-mass ratio."[5]
Protons
The Sun and the solar wind, at least that portion that originates through the polar coronal holes apparently from the photosphere, may be major sources of protons within the solar system.
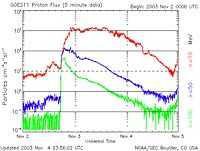
At right is a temporal distribution of solar proton flux in units of particles cm-2 s-1 sr-1 as measured by GOES 11 over the four days from November 2, 2003, to November 4, 2003, in three windows of energy: ≥ 100 MeV (green), ≥ 50 MeV (blue), and ≥ 10 MeV (red). The percentage originating from the surface of the Sun either directly or through the contribution to the solar wind is not indicated.
Electrons
"Energetic photons, ions and electrons from the solar wind, together with galactic and extragalactic cosmic rays, constantly bombard surfaces of planets, planetary satellites, dust particles, comets and asteroids."[6]
Jovian electrons propagate "along the spiral magnetic field of the interplanetary medium [from Jupiter and its magnetosphere to the Sun]".[7]
Positrons
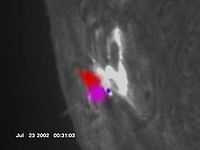
The solar flare at Active Region 10039 on July 23, 2002, exhibits many exceptional high-energy phenomena including the 2.223 MeV neutron capture line and the 511 keV electron-positron (antimatter) annihilation line. In the image at right, the RHESSI low-energy channels (12-25 keV) are represented in red and appear predominantly in coronal loops. The high-energy flux appears as blue at the footpoints of the coronal loops. Violet is used to indicate the location and relative intensity of the 2.2 MeV emission.
During solar flares “[s]everal radioactive nuclei that emit positrons are also produced; [which] slow down and annihilate in flight with the emission of two 511 keV photons or form positronium with the emission of either a three gamma continuum (each photon < 511 keV) or two 511 keV photons."[8] The Reuven Ramaty High Energy Solar Spectroscopic Imager (RHESSI) made the first high-resolution observation of the solar positron-electron annihilation line during the July 23, 2003 solar flare.[8] The observations are somewhat consistent with electron-positron annihilation in a quiet solar atmosphere via positronium as well as during flares.[8] Line-broadening is due to "the velocity of the positronium."[8] "The width of the annihilation line is also consistent ... with thermal broadening (Gaussian width of 8.1 ± 1.1 keV) in a plasma at 4-7 x 10⁵ K. ... The RHESSI and all but two of the SMM measurements are consistent with densities ≤ 1012 H cm-3 [but] <10% of the p and α interactions producing positrons occur at these low densities. ... positrons produced by 3He interactions form higher in the solar atmosphere ... all observations are consistent with densities > 1012 H cm-3. But such densities require formation of a substantial mass of atmosphere at transition region temperatures."[8]
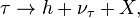
Neutrinos
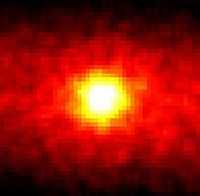
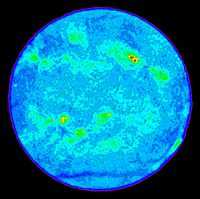
Neutrinos are hard to detect. The Super-Kamiokande, or "Super-K" is a large-scale experiment constructed in an unused mine in Japan to detect and study neutrinos. The image at right required 500 days worth of data to produce the "neutrino image" of the Sun. The image is centered on the Sun's calculated position. It covers a 90° x 90° octant of the sky (in right ascension and declination). The higher the brightness of the color, the larger is the neutrino flux.
The surface of the Sun is not a known source of neutrinos. Those detected may be from nucleosynthesis within the coronal cloud in the near vicinity of the Sun or perhaps from nucleosynthesis occurring interior to the Sun.
"[N]eutrino flux increases noted in Homestake results [coincide] with major solar flares [14]."[9]
This result together with those in the next two paragraphs establishes that neutrinos are being produced by processes above the photosphere and probably within 2-4 solar radii as most solar flares give off energy close to and into the chromosphere.
"The correlation between a great solar flare and Homestake neutrino enhancement was tested in 1991. Six major flares occurred from May 25 to June 15 including the great June 4 flare associated with a coronal mass ejection and production of the strongest interplanetary shock wave ever recorded (later detected from spacecraft at 34, 35, 48, and 53 AU) [15]. It also caused the largest and most persistent (several months) signal ever detected by terrestrial cosmic ray neutron monitors in 30 years of operation [16]. The Homestake exposure (June 1–7) measured a mean 37Ar production rate of 3.2 ± 1.5 atoms/day (≈19 37Ar atoms produced in 6 days) [13]; about 5 times the rate of ≈ 0.65 day −1 for the preceding and following runs, > 6 times the long term mean of ≈ 0.5 day−1 and > 2 1/2 times the highest rates recorded in ∼ 25 operating years."[9]
"The highest flux of solar neutrinos come directly from the proton-proton interaction, and have a low energy, up to 400 keV. There are also several other significant production mechanisms, with energies up to 18 MeV.[10]"[11]
"The parts of the Sun above the photosphere are referred to collectively as the solar atmosphere.[12]"[13]
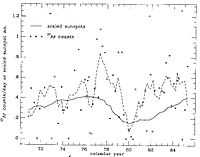
"Neutrinos can be produced by energetic protons accelerated in solar magnetic fields. Such protons produce pions, and therefore muons, hence also neutrinos as a decay product, in the solar atmosphere."[14]
"Energetic protons in the solar corona could explain Figure 2 [at right] only if (1) they tap a substantial fraction of the entire energy generated in the corona, (2) the energy generated in the corona is at least 3 times what has been deduced from the observations, (3) the vast majority of energetic protons do not escape the Sun, (4) the proton energy spectrum is unusually hard (p0 = 300 MeV c-1, and (5) the sign of the variation is opposite to what one would predict. As the likelihood of all of these conditions being fulfilled seems extremely small, we do not believe that neutrinos produced by energetic protons in the solar atmosphere contribute significantly to the neutrino capture in the 37Cl experiment."[14]
"The total number of neutrinos of all types agrees with the number predicted by the computer model of the Sun. Electron neutrinos constitute about a third of the total number of neutrinos. [...] The missing neutrinos were actually present, but in the form of the more difficult to detect muon and tau neutrinos."[15]
The reactions that produce the higher energy neutrinos: νµ and ντ are.
For antiproton-proton annihilation at rest, a meson result is, for example,
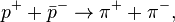
 [17] and

"All other sources of ντ are estimated to have contributed an additional 15%."[18]
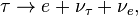
for two neutrinos.[18]
where  is a hadron, for two neutrinos.[18]
Gamma rays
The surface of the Sun has yet to be detected as a gamma ray source, reflector, or in fluorescence.
"RHESSI was the first satellite to image solar gamma rays from a solar flare[19]."[20]
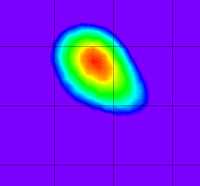
X-rays
The image at right is the first public image taken by the solar X-ray imager (SXI) aboard the GOES 14 satellite. These geostationary operational environmental satellites (GOES) monitor the Sun’s X-rays for the early detection of solar flares, coronal mass ejections (CMEs), and other phenomena that impact the geospace environment. This early warning is important because travelling solar disturbances affect not only the safety of humans in high-altitude missions, such as human spaceflight, but also military and commercial satellite communications. In addition, CMEs can damage long-distance electric power grids, causing extensive power blackouts.
The GOES satellites circle the Earth in geosynchronous orbits.
"X-ray photons can be effectively backscattered by photosphere atoms and electrons (Tomblin 1972; Bai & Ramaty 1978). ... [A]t energies not dominated by absorption the backscattered albedo flux must be seen virtually in every solar flare spectrum, the degree of the albedo contribution depending on the directivity of the primary X-ray flux (Kontar et al. 2006). The solar flare photons backscattered by the solar photosphere can contribute significantly (the reflected flux is 50-90 % of the primary in the 30 - 50 keV range for isotropic sources) to the total observed photon spectrum. for the simple case of a power-law-like primary solar flare spectrum (without albedo), the photons reflected by the photosphere produce a broad 'hump' component. Photospheric albedo makes the observed spectrum flatter below ~ 35 keV and slightly steeper above, in comparison with the primary spectrum."[21]
Opticals
| Class | B–V | U–B | V–R | R–I | Teff (K) |
|---|---|---|---|---|---|
| O5V | –0.33 | –1.19 | –0.15 | –0.32 | 42,000 |
| B0V | –0.30 | –1.08 | –0.13 | –0.29 | 30,000 |
| A0V | –0.02 | –0.02 | 0.02 | –0.02 | 9,790 |
| F0V | 0.30 | 0.03 | 0.30 | 0.17 | 7,300 |
| G0V | 0.58 | 0.06 | 0.50 | 0.31 | 5,940 |
| K0V | 0.81 | 0.45 | 0.64 | 0.42 | 5,150 |
| M0V | 1.40 | 1.22 | 1.28 | 0.91 | 3,840 |
"[T]he color index is a simple numerical expression that determines the color of an object, which in the case of a star gives its temperature. To measure the index, one observes the magnitude of an object successively through two different filters, such as U and B, or B and V, where U is sensitive to ultraviolet rays, B is sensitive to blue light, and V is sensitive to visible (green-yellow) light (see also: UBV system). The set of passbands or filters is called a photometric system. The difference in magnitudes found with these filters is called the U-B or B–V color index, respectively. The smaller the color index, the more blue (or hotter) the object is. Conversely, the larger the color index, the more red (or cooler) the object is. This is a consequence of the logarithmic magnitude scale, in which brighter objects have smaller (more negative) magnitudes than dimmer ones. ... The passbands most optical astronomers use are the UBVRI filters, where the U, B, and V filters are as mentioned above, the R filter passes red light, and the I filter passes infrared light. ... These filters were specified as particular combinations of glass filters and photomultiplier tubes."[23]
Ultraviolets
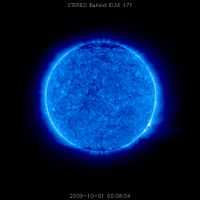
The Sun's photosphere probably generates little or no ultraviolet rays.
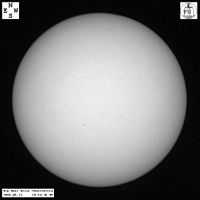
Visuals
| Class | B–V | V–R | Teff (K) |
|---|---|---|---|
| O5V | –0.33 | –0.15 | 42,000 |
| B0V | –0.30 | –0.13 | 30,000 |
| A0V | –0.02 | 0.02 | 9,790 |
| F0V | 0.30 | 0.30 | 7,300 |
| G0V | 0.58 | 0.50 | 5,940 |
| K0V | 0.81 | 0.64 | 5,150 |
| M0V | 1.40 | 1.28 | 3,840 |
"[T]he [visual] color index is a simple numerical expression that determines the color of an object, which in the case of a star gives its temperature. To measure the [visual] index, one observes the magnitude of an object successively through two different filters, such as ... B and V, where ... B is sensitive to blue light, and V is sensitive to visible (green-yellow) light ... The difference in magnitudes found with these filters is called the ... B–V color index ... The smaller the color index, the more blue (or hotter) the object is. Conversely, the larger the color index, the more red (or cooler) the object is. ... For comparison, the yellowish Sun has a B–V index of 0.656 ± 0.005,[24] while the bluish Rigel has a B–V of –0.03 (its B magnitude is 0.09 and its V magnitude is 0.12, B–V = –0.03).[25]"[23]
Violets
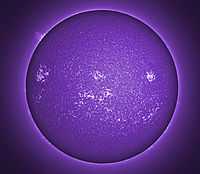
The Sun's photosphere emits over the violet (380-450 nm) band.
Blues
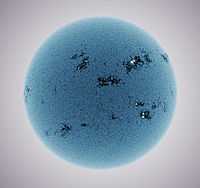
The surface of the Sun emits blue (450-475 nm) electromagnetic radiation.
Cyans
The surface of the Sun emits cyan (476-495 nm) electromagnetic radiation.
Greens
The Na I green lines at 568.2 and 568.8 nm arise "in the photospheric layers between log τ5000 ≈ -1 and -2."[26]
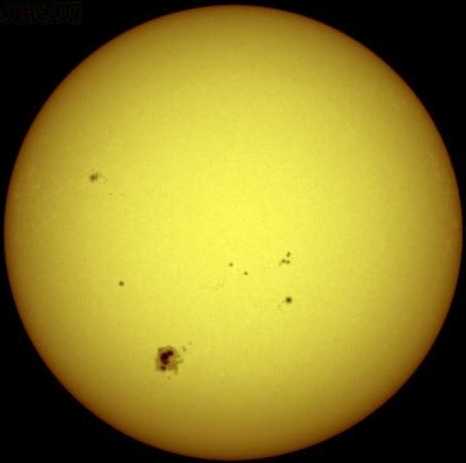
Yellows
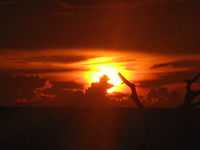
Seeing the yellow Sun and feeling the warmth of its rays is probably a student's first encounter with an astronomical yellow radiation source.
The surface of the Sun emits yellow (570-590 nm) radiation.
"Stars of spectral classes F and G, such as our sun Sol, have color temperatures that make them look "yellowish".[27]
Oranges
The surface of the Sun emits in the orange (590 to 620 nm) wavelengths.
The Na I lines at 615.4 and 616.0 nm arise "in the photospheric layers between log τ5000 ≈ -1 and -2."[26]
Reds
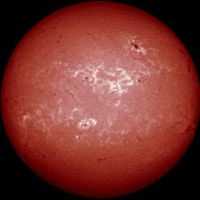
The surface of the Sun emits in the red (621 to 750 nm) wavelengths.
"[S]ome observed properties of the Sun still defy explanation, such as the degree of Li depletion" [the "solar Li abundance is roughly a factor of 200 below the meteoritic abundance"].[28]
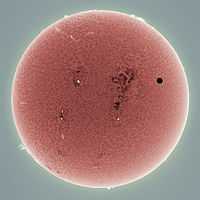
The second image down on the right is an image of the Sun during a transit of Venus at a wavelength close 620 nm.
Infrareds
The surface of the Sun emits in the infrared.
At right is a graph of the expected solar and interstellar infrared emission versus wavelength at various radial distances from the Sun.
The Na I lines at 818.3, 819.4, and 1140 nm in the near infrared arise "in the photospheric layers between log τ5000 ≈ -1 and -2."[26]
Microwaves
The surface of the Sun emits radio waves, including microwaves.
Heliognosy
While it seldom seems that listening to an entity or object in the sky is beneficial, application of the science of acoustics to studying the Sun in optical astronomy provides insight into the Sun's interior.
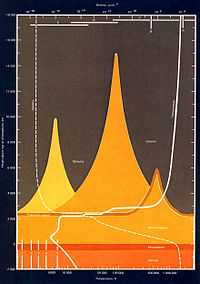
The image at right describes graphically the temperature and density of the Sun's atmosphere from the photosphere upwards. "The Sun's photosphere has a temperature between 4500 and 6000 K[29] (with an effective temperature of 5777 K) and a density of about [2 x 10⁻⁴kg/m3;[30] other stars may have hotter or cooler photospheres.
Comets
The Sun emits visual radiation that may reflect off a comet's tail. The coronal cloud in close proximity to the Sun also emits X-rays that produce visual fluorescence from gases in a comet's coma and tail.
Classical planets
"In antiquity the classical planets were the non-fixed objects visible in the sky, known to various ancient cultures. The classical planets were therefore the Sun and Moon and the five non-earth planets of our solar system closest to the sun (and closest to the Earth); all easily visible without a telescope. They are Mercury, Venus, Mars, Jupiter, and Saturn."[31]
Archeoastronomy

Technology
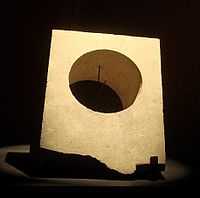
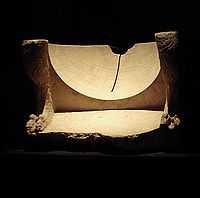
The image at right shows a sun dial from Ai Khanoum, Afghanistan, dated to the 3rd century BCE, ~2300 b2k. The image at left is also from Ai Khanoum, Afghanistan, showing its workings.
"[T]he earliest known sundial [is] from an Egyptian burial dated in the fifteenth century B.C. Sometimes called a shadow clock, or an L-board because of its shape [with] relatively crude performance."[32] A "[f]ragment of a late Egyptian sundial [from] about 3000 B.C." exists.[32]
Research
Hypothesis:
- Solar astronomy includes the various radiation astronomies focused on the Sun.
- Solar astronomy includes the effects on the Sun of revolving around the Milky Way.
Control groups

The findings demonstrate a statistically systematic change from the status quo or the control group.
“In the design of experiments, treatments [or special properties or characteristics] are applied to [or observed in] experimental units in the treatment group(s).[33] In comparative experiments, members of the complementary group, the control group, receive either no treatment or a standard treatment.[34]"[35]
Proof of concept
Def. a “short and/or incomplete realization of a certain method or idea to demonstrate its feasibility"[36] is called a proof of concept.
Def. evidence that demonstrates that a concept is possible is called proof of concept.
The proof-of-concept structure consists of
- background,
- procedures,
- findings, and
- interpretation.[37]
See also
References
- ↑ P. K. Seidelmann (1976). "Measuring the Universe The IAU and astronomical units". The International Astronomical Union. Retrieved 2011-11-27.
- 1 2 Philip B. Gove, ed (1963). Webster's Seventh New Collegiate Dictionary. Springfield, Massachusetts: G. & C. Merriam Company. pp. 1221.
- 1 2 3 4 J.C. Brown, H.E. Potts, L.J. Porter, & G.le Chat (November 8, 2011). "Mass Loss, Destruction and Detection of Sun-grazing & -impacting Cometary Nuclei". Astronomy & Astrophysics 535: 12. doi:10.1051/0004-6361/201015660. http://www.aanda.org/articles/aa/abs/2011/11/aa15660-10/aa15660-10.html. Retrieved 2012-11-25.
- ↑ Edison Pettit (July 1943). "The Properties of Solar Prominences as Related to Type". Astrophysical Journal 98 (7): 6-19. doi:10.1086/144539.
- ↑ D. L. Bertsch, C. E. Fichtel, and D. V. Reames (July 1969). "Relative Abundance of Iron-Group Nuclei in Solar Cosmic Rays". The Astrophysical Journal 157 (07): L53-6. doi:10.1086/180383. http://adsabs.harvard.edu/full/1969ApJ...157L..53B. Retrieved 2012-11-27.
- ↑ Theodore E. Madey, Robert E. Johnson, Thom M. Orlando (March 2002). "Far-out surface science: radiation-induced surface processes in the solar system". Surface Science 500 (1-3): 838-58. doi:10.1016/S0039-6028(01)01556-4. http://www.sciencedirect.com/science/article/pii/S0039602801015564. Retrieved 2012-02-09.
- ↑ H. N. Russell (1929). The Astrophysical Journal 70: 11-82.
- 1 2 Maurice Dubin and Robert K. Soberman (April 1996). "Resolution of the Solar Neutrino Anomaly". arXiv: 1-8. http://arxiv.org/abs/astro-ph/9604074. Retrieved 2012-11-11.
- ↑ A. Bellerive, Review of solar neutrino experiments. Int.J.Mod.Phys. A19 (2004) 1167-1179
- ↑ "Solar neutrino, In: Wikipedia". San Francisco, California: Wikimedia Foundation, Inc. April 4, 2012. Retrieved 2012-11-08.
- ↑ K.D. Abhyankar (1977). "A Survey of the Solar Atmospheric Models". Bull. Astr. Soc. India 5: 40–44. http://prints.iiap.res.in/handle/2248/510.
- ↑ "Sun, In: Wikipedia". San Francisco, California: Wikimedia Foundation, Inc. June 29, 2013. Retrieved 2013-07-07.
- 1 2 J. N. Bahcall and G. B. Field and W. H. Press (September 1, 1987). "Is solar neutrino capture rate correlated with sunspot number?". The Astrophysical Journal 320 (9): L69-73. doi:10.1086/184978. http://articles.adsabs.harvard.edu//full/1987ApJ...320L..69B/L000069.000.html. Retrieved 2013-07-07.
- ↑ John N. Bahcall (April 28, 2004). "Solving the Mystery of the Missing Neutrinos". Nobel Media AB. Retrieved 2014-03-08.
- ↑ Eberhard Klempt, Chris Batty, Jean-Marc Richard (July 2005). "The antinucleon-nucleon interaction at low energy: annihilation dynamics". Physics Reports 413 (4-5): 197-317. doi:10.1016/j.physrep.2005.03.002. http://adsabs.harvard.edu/abs/2005PhR...413..197K. Retrieved 2014-03-09.
- ↑ Eli Waxman and John Bahcall (December 14, 1998). "High energy neutrinos from astrophysical sources: An upper bound". Physical Review D 59 (2): e023002. doi:10.1103/PhysRevD.59.023002. http://prd.aps.org/abstract/PRD/v59/i2/e023002. Retrieved 2014-03-09.
- 1 2 3 4 5 6 K. Kodama, N. Ushida1, C. Andreopoulos, N. Saoulidou, G. Tzanakos, P. Yager, B. Baller, D. Boehnlein, W. Freeman, B. Lundberg, J. Morfin, R. Rameika, J.C. Yun, J.S. Song, C.S. Yoon, S.H.Chung, P. Berghaus, M. Kubanstev, N.W. Reay, R. Sidwell, N. Stanton, S. Yoshida, S. Aoki, T. Hara, J.T. Rhee, D. Ciampa, C. Erickson, M. Graham, K. Heller, R. Rusack, R. Schwienhorst, J. Sielaff, J. Trammell, J. Wilcox, K. Hoshino, H. Jiko, M. Miyanishi, M. Komatsu, M. Nakamura, T. Nakano, K. Niwa, N. Nonaka, K. Okada, O. Sato, T. Akdogan, V. Paolone, C. Rosenfeld, A. Kulik, T. Kafka, W. Oliver, T. Patzak, and J. Schneps (April 12, 2001). "Observation of tau neutrino interactions". Physics Letters B 504 (3): 218-24. http://www.sciencedirect.com/science/article/pii/S0370269301003070. Retrieved 2014-03-10.
- ↑ First Gamma-Ray Images of a Solar Flare (Hurford et al. 2003)
- ↑ "Reuven Ramaty High Energy Solar Spectroscopic Imager, In: Wikipedia". San Francisco, California: Wikimedia Foundation, Inc. October 27, 2012. Retrieved 2012-11-20.
- ↑ Jana Kašparová, Eduard P. Kontar, and John C. Brown (May 1, 2007). "Hard X-ray Spectra and Positions of Solar Flares observed by RHESSI: photospheric albedo, directivity and electron spectra". Astronomy & Astrophysics 466 (2): 705-12. doi:10.1051/0004-6361:20066689. http://www.aanda.org/articles/aa/full/2007/17/aa6689-06/table1.tex. Retrieved 2012-11-27.
- 1 2 Martin V. Zombeck (1990). Calibration of MK spectral types, In: Handbook of Space Astronomy and Astrophysics (2nd ed.). Cambridge University Press. p. 105. ISBN 0-521-34787-4.
- 1 2 "Color index, In: Wikipedia". San Francisco, California: Wikimedia Foundation, Inc. November 18, 2012. Retrieved 2012-11-20.
- ↑ David F. Gray (November 1992). "The Inferred Color Index of the Sun". Publications of the Astronomical Society of the Pacific 104 (681): 1035-8.
- ↑ {{cite web title=Rigel |url=http://simbad.u-strasbg.fr/sim-id.pl?protocol=html&Ident=Rigel&NbIdent=1&Radius=10&Radius.unit=arcmin&CooFrame=FK5&CooEpoch=2000&CooEqui=2000&output.max=all&o.catall=on&output.mesdisp=N&Bibyear1=1983&Bibyear2=2006&Frame1=FK5&Frame2=FK4&Frame3=G&Equi1=2000.0&Equi2=1950.0&Equi3=2000.0&Epoch1=2000.0&Epoch2=1950.0&Epoch3=2000.0 }}
- 1 2 3 D. Baumüller, K. Butler, and T. Gehren (October 1998). "Sodium in the Sun and in metal-poor stars". Astronomy and Astrophysics 338: 637-50.
- ↑ Ron Miller (2005). Stars and Galaxies. Twenty-First Century Books. p. 22. ISBN 9780761334668. http://books.google.com/?id=QL9uAfad1ggC&pg=PA22.
- ↑ Jeremy R. King, Constantine P. Deliyannis, and Merchant Boesgaard (April 1, 1997). "The 9Be Abundances of α Centauri A and B and the Sun: Implications for Stellar Evolution and Mixing". The Astrophysical Journal 478 (2): 778. http://iopscience.iop.org/0004-637X/478/2/778. Retrieved 2012-07-11.
- ↑ The Sun - Introduction
- ↑ "SP-402 A New Sun: The Solar Results From Skylab".
- ↑ "Classical planet, In: Wikipedia". San Francisco, California: Wikimedia Foundation, Inc. July 21 2013. Retrieved 2013-09-26.
- 1 2 Winthrop W. Dolan (1975). A Choice of Sundials. S. Greene Press. pp. 146. ISBN 0828902100. http://books.google.com/books?id=q3IsAQAAIAAJ&hl=en. Retrieved 2012-10-24.
- ↑ Klaus Hinkelmann, Oscar Kempthorne (2008). Design and Analysis of Experiments, Volume I: Introduction to Experimental Design (2nd ed.). Wiley. ISBN 978-0-471-72756-9. http://books.google.com/?id=T3wWj2kVYZgC&printsec=frontcover.
- ↑ R. A. Bailey (2008). Design of comparative experiments. Cambridge University Press. ISBN 978-0-521-68357-9. http://www.cambridge.org/uk/catalogue/catalogue.asp?isbn=9780521683579.
- ↑ "Treatment and control groups, In: Wikipedia". San Francisco, California: Wikimedia Foundation, Inc. May 18, 2012. Retrieved 2012-05-31.
- ↑ "proof of concept, In: Wiktionary". San Francisco, California: Wikimedia Foundation, Inc. November 10, 2012. Retrieved 2013-01-13.
- ↑ Ginger Lehrman and Ian B Hogue, Sarah Palmer, Cheryl Jennings, Celsa A Spina, Ann Wiegand, Alan L Landay, Robert W Coombs, Douglas D Richman, John W Mellors, John M Coffin, Ronald J Bosch, David M Margolis (August 13, 2005). "Depletion of latent HIV-1 infection in vivo: a proof-of-concept study". Lancet 366 (9485): 549-55. doi:10.1016/S0140-6736(05)67098-5. http://www.ncbi.nlm.nih.gov/pmc/articles/PMC1894952/. Retrieved 2012-05-09.
External links
- African Journals Online
- Bing Advanced search
- Google Books
- Google scholar Advanced Scholar Search
- International Astronomical Union
- JSTOR
- Lycos search
- NASA/IPAC Extragalactic Database - NED
- NASA's National Space Science Data Center
- NCBI All Databases Search
- Office of Scientific & Technical Information
- PubChem Public Chemical Database
- Questia - The Online Library of Books and Journals
- SAGE journals online
- The SAO/NASA Astrophysics Data System
- Scirus for scientific information only advanced search
- SDSS Quick Look tool: SkyServer
- SIMBAD Astronomical Database
- SIMBAD Web interface, Harvard alternate
- Spacecraft Query at NASA.
- SpringerLink
- Taylor & Francis Online
- Universal coordinate converter
- Wiley Online Library Advanced Search
- Yahoo Advanced Web Search
![]() This is a research project at http://en.wikiversity.org
This is a research project at http://en.wikiversity.org
| |
Development status: this resource is experimental in nature. |
| |
Educational level: this is a research resource. |
| |
Resource type: this resource is an article. |
| |
Resource type: this resource contains a lecture or lecture notes. |
| |
Subject classification: this is an astronomy resource. |