Rocks/Ice sheets
< Rocks
An ice sheet is a permanent layer of ice covering an extensive tract of land or sea.
An ice field is more than one glacier with a common source. Several ice fields can become an ice cap. When the ice cap becomes large enough it is an ice sheet.
Shown in the northern hemisphere image on the right is the rock distribution of sea ice and land ice.
Antarctic ice sheets
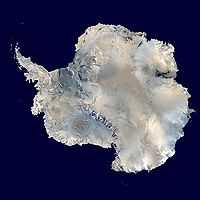
"The only current ice sheets are in Antarctica and Greenland; during the last glacial period at Last Glacial Maximum (LGM) the Laurentide ice sheet covered much of North America, the Weichselian ice sheet covered northern Europe and the Patagonian Ice Sheet covered southern South America."[1]
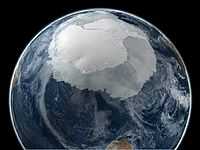
At the south pole, Antactica, there is also an extensive ice sheet shown in the second image on the right. Seasonally, when the North polar sea ice and ice sheet has been contracting, the South polar sea ice and ice sheet has been expanding.
Apparent global warming that was progressively melting more and more of the north polar ice sheet each year has been countered by progressive expansion of the south polar ice sheet.
Greenland ice sheets
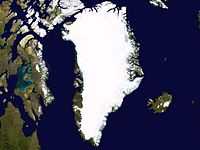
At the right is a satellite composite image of the ice sheet over Greenland.
"Active and passive microwave satellite data are used to map snowmelt extent and duration on the Greenland ice sheet. The passive microwave (PM) data reveal the extreme melt extent of 690,000 km2 in 2002 as compared with an average extent of 455,000 km2 from 1979–2003."[2]
"Several PM-based melt assessment algorithms [Mote and Anderson, 1995; Abdalati and Steffen, 1995] are applicable to Scanning Multi-channel, Microwave Radiometer (SMMR) and Special Sensor Microwave/Imager (SSM/I) instruments providing near-continuous coverage since 1979. The PM data as gridded brightness temperatures on polar stereographic grids (25 km resolution) [used] are from the National Snow and Ice Data Center [Maslanik and Stroeve, 2003], containing daily data spanning 25 melt seasons from 1979 to 2003."[2]
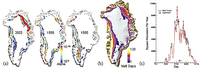
In the second image on the right, (a) "shows the probabilities of the observed melt behavior on the Greenland ice sheet for several large melt years and indicates the extreme melt anomaly observed in northeastern Greenland in 2002."[2]
"Prior to 2002, both 1995 and 1998 were extreme melt years in terms of maximum areal extent and total melt. During 1995 melt was dominated by a high frequency of melt along the western margin of the ice sheet. During 1998 melt was spatially diverse with slightly more melt than usual in the northeast and southwest. However, the high frequency melt in 2002 in the northeast and along the western margin is unprecedented in the PM record with a log likelihood of occurrence that is 35% lower than the previous record melt anomaly in 1991."[2]
(c) "depicts the magnitude of the increasing trends in melt extent on a daily basis over the last 25 years. Although there is a large amount of inter-annual variability in melt extent on a given day, 56 days show statistically significant (alpha = 0.1) increasing trends in melt area."[2]
"Melt along the west coast was extensive during 2002 but not atypical for large melt years. However melt in the north and northeast was highly irregular both in terms of extent and frequency. Nearly 3,000 km2[(b)] were classified as melting during 2002 that had not previously melted during any other year between 1979 and 2003."[2]
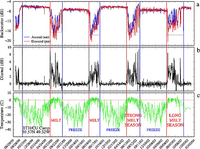
The figure at the left "presents QSCAT backscatter and diurnal signatures, and ETH/CU AWS air temperature."[2] Half-decade records for ETH/CU Camp station: (a) Top panel is for QSCAT backscatter, (b) middle panel for QSCAT diurnal signature, and (c) bottom panel for air temperature measured at the AWS site.[2]
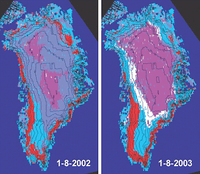
At the lower right QSCAT melt maps are shown on the climatological peak-melt day (1 August). Red color represents current active melt areas, light blue is for areas that have melted but currently refreeze, white is for areas that will melt later, and magenta is for areas that do not experience any melt throughout the melt season. The dark blue color surrounding Greenland is the ocean mask.
"QSCAT mapping can reveal details of the spatial pattern of surface melt evolution in time. There are large variabilities in melt extent and melt timing over different regions. [The figure at tje lower right] confirms that 2002 has the most extensive areal melt. In 2002, the northeast quadrant of the Greenland ice sheet, extending well into the dry snow zone, experienced at least some melt where melt never happened before (from satellite data records to date). Since the beginning of the QSCAT data record (July 1999), the smallest spatial extent of melt occurred in 2001, and melt extent was similar for years 2000 and 2003."[2]
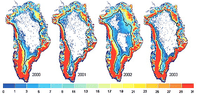
"To provide a direct comparison of PM and QSCAT results, we overlay results for PM melt extent and QSCAT number of melt days in [the figure at the lower left] for years 2000–2003. PM XPGR melt extent is approximately confined to QSCAT melt areas experiencing 2 weeks or more of melting time [the figure at the lower left]. QSCAT melt areas outside of the PM melt extent represent the surface that has less melt corresponding to about 15 melt days or less. This is consistent with the relationship of relative melt strength measured by active and passive data as discussed above. Note that such areas can total up to a large region in year 2002. Surface albedo can reduce considerably once the snow melts for a period of 2 weeks. The albedo reduction may significantly impact the surface heat balance and thus change the mass balance. The large number of melt days around the northern perimeter of the ice sheet, which is shown as the narrow dark-red band in north Greenland in the 2003 map was an anomalous feature [the figure at the lower left]. This band was wider as defined by the PM melt extent in 2002 than in 2003. However, there were more QSCAT melt days in the 2003 northern melt band."[2]
"The comparison reveals that the PM cross-polarized gradient algorithm classifies melt more conservatively than the scatterometer algorithm. The active microwave identifies melt approximately up to two weeks more than the PM at higher elevation in the percolation zone toward the dry snow zone [the figure at the lower left]. Both methods (active and passive microwave) consistently identify melt areas that have a melt duration of at least 10–14 days. The longer snowmelt duration can be sufficient to decrease surface albedo and affect surface heat and mass balance."[2]
Himalayas ice sheets
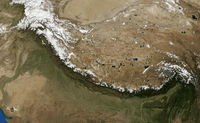
Often called the third pole, the image on the right shows the rocky ice sheet over the top of the Himalayas.
Ice streams
Def. "a current of ice in an ice sheet or ice cap that flows faster than the surrounding ice"[3] is called an ice stream.
Ice caps
Def. "a dome-shaped mass of glacier ice that spreads out in all directions"[3] is called an ice cap.
Theoretical ice sheets
Def. "a dome-shaped mass of glacier ice that covers surrounding terrain and is greater than 50,000 square kilometers (12 million acres)"[3] is called an ice sheet.
Earth
Earth has ice sheets, ice caps, ice fields, and glaciers.
Original research
- See also: Original research inquiry and Research
Hypothesis:
- The closer a rocky object is to Saturn the more ice it has on its surface.
- See also: Control groups, Proof of concept, and Proof of technology
See also
References
- ↑ "Ice sheet, In: Wikipedia". San Francisco, California: Wikimedia Foundation, Inc. June 6, 2013. Retrieved 2013-06-23.
- 1 2 3 4 5 6 7 8 9 10 11 K. Steffen, S. V. Nghiem, R. Huff, and G. Neumann (21 October 2004). "The melt anomaly of 2002 on the Greenland Ice Sheet from active and passive microwave satellite observations". Geophysical Research Letters 21 (20). doi:10.1029/2004GL020444.
- 1 2 3 Jane Beitler (19 September 2014). "Cryosphere Glossary". National Snow and Ice Data Center. Retrieved 2014-09-17.
External links
![]() This is a research project at http://en.wikiversity.org
This is a research project at http://en.wikiversity.org
| |
Educational level: this is a research resource. |
| |
Resource type: this resource is an article. |
| |
Resource type: this resource contains a lecture or lecture notes. |
| |
Subject classification: this is a Geology resource. |