Radiation astronomy/Radars
< Radiation astronomy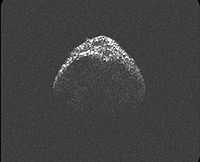
Radar astronomy is used to detect and study astronomical objects that reflect radio rays.
The image at right is of asteroid 2012 LZ1 using the Arecibo Planetary Radar.
Astronomy
"Radar astronomy is a technique of observing nearby astronomical objects by reflecting microwaves off target objects and analyzing the echoes. [...] Radar astronomy differs from radio astronomy in that the latter is a passive observation and the former an active one. [...] The radar transmission may either be pulsed or continuous."[1]
"Radar [...] directly measures the distance to the object (and how fast it is changing). The combination of optical and radar observations normally allows the prediction of orbits at least decades, and sometimes centuries, into the future."[1]"
"The maximum range of astronomy by radar is very limited, and is confined to the solar system. This is because the signal strength drops off very steeply with distance to the target, the small fraction of incident flux that is reflected by the target, and the limited strength of transmitters.[2] It is also necessary to have a relatively good ephemeris of the target before observing it."[1]
Radars
“Radio waves are a type of electromagnetic radiation with wavelengths in the electromagnetic spectrum longer than infrared light. Radio waves have frequencies from 300 [Gigahertz] GHz to as low as 3 [Kilohertz] kHz, and corresponding [to] wavelengths from 1 millimeter to 100 kilometers."[3]
| Band name | Frequency range | Wavelength range | Notes |
|---|---|---|---|
| HF | 3–30 MHz | 10–100 m | Coastal radar systems, over-the-horizon radar (OTH) radars; 'high frequency' |
| VHF | 30–300 MHz | 1–10 m | Very long range, ground penetrating; 'very high frequency' |
| P | < 300 MHz | > 1 m | 'P' for 'previous', applied retrospectively to early radar systems; essentially HF + VHF |
| UHF | 300–1000 MHz | 0.3–1 m | Very long range (e.g. ballistic missile early warning), ground penetrating, foliage penetrating; 'ultra high frequency' |
| L | 1–2 GHz | 15–30 cm | Long range air traffic control and surveillance; 'L' for 'long' |
| S | 2–4 GHz | 7.5–15 cm | Moderate range surveillance, Terminal air traffic control, long-range weather, marine radar; 'S' for 'short' |
| C | 4–8 GHz | 3.75–7.5 cm | Satellite transponders; a compromise (hence 'C') between X and S bands; weather; long range tracking |
| X | 8–12 GHz | 2.5–3.75 cm | Missile guidance, marine radar, weather, medium-resolution mapping and ground surveillance; in the USA the narrow range 10.525 GHz ±25 MHz is used for airport radar; short range tracking. Named X band because the frequency was a secret during WW2. |
| Ku | 12–18 GHz | 1.67–2.5 cm | High-resolution, also used for satellite transponders, frequency under K band (hence 'u') |
| K | 18–24 GHz | 1.11–1.67 cm | From German kurz, meaning 'short'; limited use due to absorption by water vapour, so Ku and Ka were used instead for surveillance. K-band is used for detecting clouds by meteorologists, and by police for detecting speeding motorists. K-band radar guns operate at 24.150 ± 0.100 GHz. |
| Ka | 24–40 GHz | 0.75–1.11 cm | Mapping, short range, airport surveillance; frequency just above K band (hence 'a') Photo radar, used to trigger cameras which take pictures of license plates of cars running red lights, operates at 34.300 ± 0.100 GHz. |
| mm | 40–300 GHz | 1.0–7.5 mm | Millimetre band, subdivided as below. The frequency ranges depend on waveguide size. Multiple letters are assigned to these bands by different groups. These are from Baytron, a now defunct company that made test equipment. |
| V | 40–75 GHz | 4.0–7.5 mm | Very strongly absorbed by atmospheric oxygen, which resonates at 60 GHz. |
| W | 75–110 GHz | 2.7–4.0 mm | Used as a visual sensor for experimental autonomous vehicles, high-resolution meteorological observation, and imaging. |
Planetary science
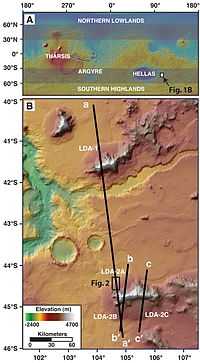
"Radar waves penetrate the surface and pass through materials that do not severely attenuate or scatter them. Reflections arise from interfaces with dielectric contrasts. [Shallow radar] SHARAD has penetrated the ∼2-km-thick polar layered deposits in both the north and south, detecting many internal reflectors (17, 18). Smaller targets can be more challenging because SHARAD's antenna pattern is broad, resulting in surface reflections up to a few tens of kilometers away from the suborbital point in rugged areas, versus only a few kilometers in smooth, flat areas. These off-nadir echoes can appear at time delays similar to those arising from subsurface interfaces, so steps are required to avoid misinterpreting this surface clutter as subsurface echoes. Synthetic-aperture data processing is used to improve along-track resolution to ∼300 m, greatly reducing along-track clutter and focusing the surface and subsurface features. We used the known topography of the surface and the radar geometry to model cross-track clutter together with nadir surface echoes [...]. Comparisons of radar sounding data with these synthetic surface echoes and the examination of possible surface echo sources in imagery (19) were undertaken for all cases [...]; such a procedure is a necessary part of radar sounding data interpretation in high-relief environments."[4]
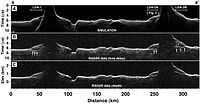
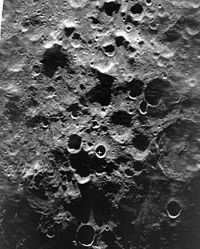
The "Shallow Radar (SHARAD) (15) on the Mars Reconnaissance Orbiter (MRO) to probe the internal structure of several LDAs surrounding massifs on the eastern rim of the Hellas impact basin [first image at the right] where more than 90 LDA complexes flank steep topography (2, 6, 16). The southernmost LDA we studied (LDA-2, [figure at the upper right] has multiple lobes that coalesce to form a continuous deposit extending more than 20 km outward from a massif along ∼170 km of its margins."[4]
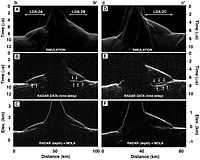
"Examination of radar data from SHARAD orbit 6830 where it crosses multiple [lobate debris aprons] LDAs in the eastern Hellas region [...] shows that the only radar reflections not matching simulated surface echoes occur where the spacecraft passes over each LDA [...]; therefore, these echoes are interpreted as arising from within or beneath the LDAs. In one case (LDA-2A), surface clutter is predicted near the terminus of the LDA, where it may obscure portions of a subsurface reflector that clearly extends farther inward below the LDA. LDA-2A and LDA-2B [image at the lower right] show evidence for multiple, closely spaced subsurface reflectors indicating the presence of at least one thin (∼70 m assuming a water-ice composition), distinct deposit below thicker deposits (up to 800 m)."[4]
Theoretical radar astronomy
Here's a theoretical definition:
Def. the branch of astronomy that uses radar to map the surfaces of planetary bodies in the solar system is called radar astronomy.
Opticals
By optical astronomy, "optical observations measure very accurately where an object appears on the sky, but cannot measure the distance accurately at all."[1]
Mercury
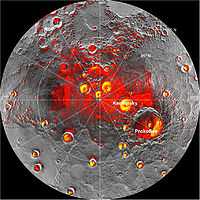
Radar astronomy of Mercury "[improved the] value for the distance from the earth [including the rotational] period, libration, [and] surface mapping, [especially] of [the] polar regions."[1]
In "1991, [...] the Arecibo radio telescope in Puerto Rico detected unusually radar-bright patches at Mercury's poles, spots that reflected radio waves in the way one would expect if there were water ice [denoted in the image at right by yellow areas]. Many of these patches corresponded to the location of large impact craters mapped by the Mariner 10 spacecraft in the 1970s."[5]
"Images from the spacecraft's Mercury Dual Imaging System taken in 2011 and earlier this year confirmed that radar-bright features at Mercury's north and south poles are within shadowed regions on Mercury's surface, findings that are consistent with the water-ice hypothesis."[5]
"The neutron data indicate that Mercury's radar-bright polar deposits contain, on average, a hydrogen-rich layer more than tens of centimeters thick beneath a surficial layer 10 to 20 centimeters thick that is less rich in hydrogen".[6]
"The buried layer has a hydrogen content consistent with nearly pure water ice."[6]
"These reflectance anomalies are concentrated on poleward-facing slopes and are spatially collocated with areas of high radar backscatter postulated to be the result of near-surface water ice".[7]
"Correlation of observed reflectance with modeled temperatures indicates that the optically bright regions are consistent with surface water ice."[7]
MESSENGER's Mercury Laser Altimeter (MLA) data "show that the spatial distribution of regions of high radar backscatter is well matched by the predicted distribution of thermally stable water ice".[8]
Venus
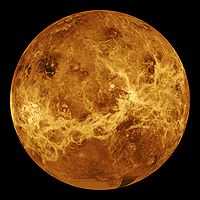
"The first un-ambiguous detection of Venus was made by [the] Jet Propulsion Laboratory (JPL) on 10 March 1961. A correct measurement of the AU soon followed."[1]
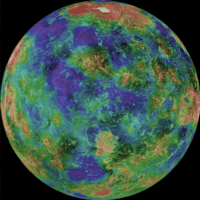
"The advantages of radar in planetary astronomy result from (1) the observer's control of all the attributes of the coherent signal used to illuminate the target, especially the wave form's time/frequency modulation and polarization; (2) the ability of radar to resolve objects spatially via measurements of the distribution of echo power in time delay and Doppler frequency; (3) the pronounced degree to which delay-Doppler measurements constrain orbits and spin vectors; and (4) centimeter-to-meter wavelengths, which easily penetrate optically opaque planetary clouds and cometary comae, permit investigation of near-surface macrostructure and bulk density, and are sensitive to high concentrations of metal or, in certain situations, ice."[9]
The radar image at left shows that just beneath the cloud layers is a rocky object.
Earth
"[N]umerous airborne and spacecraft radars have mapped the entire planet, for various purposes. One example is the Shuttle Radar Topography Mission, which mapped the entire Earth at 30 m resolution."[1]
Moon
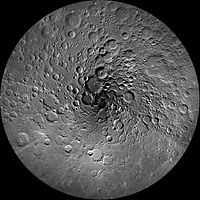
"The moon is comparatively close and was detected by radar, soon after the invention of the technique, in 1946.[10][11] Measurements included surface roughness and later mapping of shadowed regions near the poles."[1]
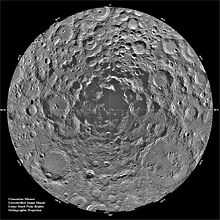
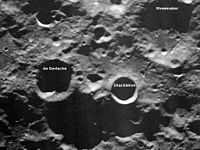
"Clementine orbited the Moon in 1994 for 71 days, mapping the Moon globally in 11 wavelengths and measuring its topography by laser ranging. [... The] bistatic radar experiment (so-called because the spacecraft transmitted while we listened to the echoes on Earth) found evidence in the dark areas near the south pole of the Moon for material with high circular polarization ratio [CPR]".[12]
"Meanwhile, astronomers on Earth began publishing results questioning the Clementine and Lunar Prospector [1998-2000] results. With the giant Arecibo radiotelescope, radar images were taken from the Earth. They found radar reflections with high CPR lying in both permanent darkness and in sunlit areas. Ice is not stable in sunlight, so they postulated that all high CPR is caused by surface roughness; if any ice is at the lunar poles, it must be in a finely disseminated form, invisible to radar mapping."[12]
The experiment from Clemintine "was bistatic, i.e., the transmitter and receiver were in different places. Bistatic radar has the advantage of observing reflections through the phase angle, the angle between transmitted and received radio rays [...]. This phase dependence is important. It’s similar to the effect one gets from looking at a bicycle reflector at just the right angle: at certain angles, the internal planes in the transparent plastic align and a very bright reflection is seen. Similarly, in both radio and visible wavelengths on the Moon, we see an “opposition surge”, an apparent increase in brightness looking directly down from the sun (zero phase). Clementine orbited the Moon such that we could observe its phase dependence [...] and we specifically looked for this “opposition surge”, called the Coherent Backscatter Opposition Effect (CBOE). CBOE is particularly valuable to identify ice on planetary surfaces."[12]
"Clementine transmitted right circular polarized (RCP) radio and we listened on Earth in both right- and left-circular polarized (LCP) channels. The ratio of power received in these two channels is called the circular polarization ratio (CPR). The dry, equatorial Moon has CPR less than one, but the icy satellites of Jupiter all have CPR greater than one. We know these objects have surfaces of water ice; in this case, the ice acts as a radio-transparent media in which waves penetrate the ice, are scattered and reflected multiple times, and returned such that some of the waves are received in the same polarization sense as they are sent—they have CPR greater than unity"[12]
"The problem with CPR alone is that we can also get high values from very rough surfaces, such as a rough, blocky lava flow, which has angles that form many small corner reflectors. In this case, a radio wave could hit a rock face (changing RCP into LCP) and then bounce over to another rock face (changing the LCP back into RCP) and hence to the receiver [...]. This “double-bounce” effect also creates high CPR in that “same sense” reflections could mimic the enhanced CPR one gets from ice targets."[12]
At lower right is an image using the Goldstone DSS-14 antenna as a transmitter and the DSS-13 as a receiver, a form of radar interferometry. The cross for the south pole in the Arecibo image is in the Shackleton crater of the Goldstone image.
Mars
"Mapping of surface roughness [has been performed] from Arecibo Observatory. The Mars Express mission carries a ground-penetrating radar."[1]
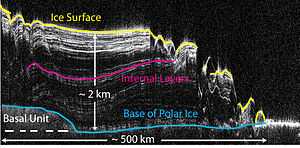
The image at right "shows a cross-section of a portion of the north polar ice cap of Mars, derived from data acquired by the Mars Reconnaissance Orbiter's Shallow Radar (SHARAD), one of six instruments on the spacecraft. The data depict the region's internal ice structure, with annotations describing different layers. The ice depicted in this graphic is approximately 2 kilometers (1.2 miles) thick and 250 kilometers (155 miles) across. White lines show reflection of the radar signal back to the spacecraft. Each line represents a place where a layer sits on top of another. Scientists study how thick the pancake-like layers are, where they bulge and how they tilt up or down to understand what the surface of the ice sheet was like in the past as each new layer was deposited."[13]
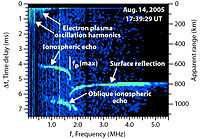
The image at left, "called an ionogram, shows data from sounding Mars' ionosphere with the Mars Advanced Radar for Subsurface and Ionospheric Sounding (MARSIS). The horizontal axis is the frequency of the pulse. The left vertical axis is the time delay after transmitting the pulse, with time increasing downward. The right vertical axis is a conversion of time delay to distance, showing the apparent range to the reflection point. The intensity of the received signal at any given frequency and apparent range is indicated by the color, with dark blue being the least intense and green being the most intense."[14]
"The green echo at an apparent range of about 800 kilometers (497 miles) from 2.5 to 5.5 megahertz is the reflected signal from the surface of Mars. The curved bright green feature with an apparent range varying from about 600 to 750 kilometers (373 to 466 miles) at frequencies from about 0.7 to 1.8 megahertz is the echo from the top side of the ionosphere. A second echo of the ionosphere, at an apparent range of about 100 kilometers (62 miles) is labeled "Oblique ionospheric echo." Such echoes are believed to come from distorted structures in the ionosphere caused by the magnetic fields in the crust of Mars."[14]
"MARSIS is an instrument on the European Space Agency's Mars Express orbiter."[14]
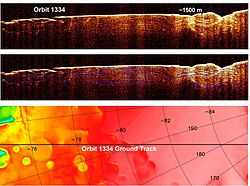
At lower right is a "radargram from the Shallow Subsurface Radar instrument (SHARAD)".[15]
The "Shallow Subsurface Radar instrument (SHARAD) on NASA's Mars Reconnaissance Orbiter [radargram] is shown in the upper-right panel and reveals detailed structure in the polar layered deposits of the south pole of Mars."[15]
"The sounding radar collected the data presented here during orbit 1334 of the mission, on Nov. 8, 2006."[15]
"The horizontal scale in the radargram is distance along the ground track. It can be referenced to the ground track map shown in the lower right. The radar traversed from about 75 to 85 degrees south latitude, or about 590 kilometers (370 miles). The ground track map shows elevation measured by the Mars Orbiter Laser Altimeter on NASA's Mars Global Surveyor orbiter. Green indicates low elevation; reddish-white indicates higher elevation. The traverse proceeds up onto a plateau formed by the layers."[15]
"The vertical scale on the radargram is time delay of the radar signals reflected back to Mars Reconnaissance Orbiter from the surface and subsurface. For reference, using an assumed velocity of the radar waves in the subsurface, time is converted to depth below the surface at one place: about 1,500 meters (5,000 feet) to one of the deeper subsurface reflectors. The color scale varies from black for weak reflections to white for strong reflections."[15]
"The middle panel shows mapping of the major subsurface reflectors, some of which can be traced for a distance of 100 kilometers (60 miles) or more. The layers are not all horizontal and the reflectors are not always parallel to one another. Some of this is due to variations in surface elevation, which produce differing velocity path lengths for different reflector depths. However, some of this behavior is due to spatial variations in the deposition and removal of material in the layered deposits, a result of the recent climate history of Mars."[15]
"The Shallow Subsurface Radar was provided by the Italian Space Agency (ASI). Its operations are led by the University of Rome and its data are analyzed by a joint U.S.-Italian science team."[15]
Asteroids
The image at the top of the page is of asteroid 2012 LZ1.
"On Sunday, June 10, a potentially hazardous asteroid thought to have been 500 meters (0.31 miles) wide was discovered by Siding Spring Observatory in New South Wales, Australia. Fortunately for us, asteroid 2012 LZ1 drifted safely by, coming within 14 lunar distances from Earth on Thursday, June 14."[16]
"Asteroid 2012 LZ1 is actually bigger than thought… in fact, it is quite a lot bigger. 2012 LZ1 is one kilometer wide (0.62 miles), double the initial estimate."[16]
Asteroid "2012 LZ1′s surface is really dark, reflecting only 2-4 percent of the light that hits it — this contributed to the underestimated initial optical observations. Looking for an asteroid the shade of charcoal isn’t easy."[16]
“This object turned out to be quite a bit bigger than we expected, which shows how important radar observations can be, because we’re still learning a lot about the population of asteroids”.[17]
“The sensitivity of our radar has permitted us to measure this asteroid’s properties and determine that it will not impact the Earth at least in the next 750 years”.[18]
"The extremely accurate astrometry provided by radar is critical in long-term predictions of asteroid-Earth impacts, as illustrated by the object 99942 Apophis."[1]
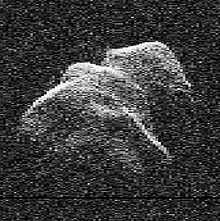
At right is a Goldstone radar image of the asteroid 4179 Toutatis on November 26, 1996.
The "images were recorded at NASA's Deep Space Network 70-meter and 34-meter radio/radar antennas in Goldstone, CA, and the 305-meter Arecibo Radio Telescope in Puerto Rico."[19]
"It's amazing that the shape of Toutatis can be determined so accurately from ground-based observations".[20]
"This technology will provide us with startling, close-up views of thousands of asteroids that orbit near the Earth."[20]
"We used the computer to mathematically create a three- dimensional model of the surface and rotation of Toutatis".[21]
"It's as though we put a clay model in space and molded it until it matched the appearance of the actual asteroid."[21]
"The video is of particular interest as Toutatis nears Earth and makes its closest approach on Friday, Nov. 29, when it will pass by at a distance of 3.3 million miles (5.3 million kilometers), or about 14 times the distance from the Earth to the Moon. In 2004, Toutatis will pass only four lunar distances from Earth, closer than any known Earth- approaching object expected to pass by in the next 60 years."[19]
"Toutatis poses no significant threat to Earth, at least for a few hundred years".[22]
"The discovery that we live in an asteroid swarm is important for the future of humanity".[22]
"These leftover debris from planetary formation can teach us a good deal about the formation of our Solar System. Asteroids also contain valuable minerals and many are the cheapest possible destinations for space missions."[22]
Jupiter
Between September and November 23, 1963, Jupiter is detected by radar astronomy.[23]
"The dense atmosphere makes a penetration to a hard surface (if indeed one exists at all) very unlikely. In fact, the JPL results imply a correlation of the echo with Jupiter ... which corresponds to the upper (visible) atmosphere. ... Further observations will be needed to clarify the current uncertainties surrounding radar observations of Jupiter."[23]
"Although in 1963 some claimed to have detected echoes from Jupiter, these were quite weak and have not been verified by later experiments."[24]
"A search for radar echoes from Jupiter at 430 MHz during the oppositions of 1964 and 1965 failed to yield positive results, despite a sensitivity several orders of magnitude better than employed by other groups in earlier (1963) attempts at higher frequencies. ... [I]t might be suspected that meteorological disturbances of a random nature were involved, and that the echoes might be returned only in exceptional circumstances. Further support for this point of view may be gleaned from the fact that JPL found positive results for only 1 (centered at 32° System I longitude) of the 8 longitude regions investigated in 1963 (Goldstein 1964) and, in fact, had no success during their observations in 1964 (see comment by Goldstein following Dyce 1965)."[25]
Titan
Radar detection of Titan "from Arecibo Observatory, [included] mapping of Titan's surface"[1].
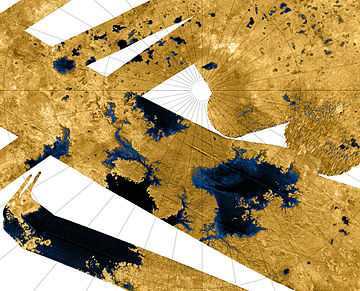
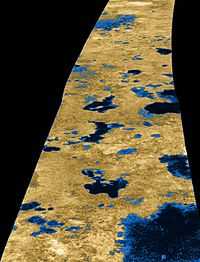
"This Cassini false-color mosaic [at right] shows all synthetic-aperture radar images to date of Titan's north polar region. Approximately 60 percent of Titan's north polar region, above 60 degrees north latitude, is now mapped with radar. About 14 percent of the mapped region is covered by what is interpreted as liquid hydrocarbon lakes."[26]
"Features thought to be liquid are shown in blue and black, and the areas likely to be solid surface are tinted brown. The terrain in the upper left of this mosaic is imaged at lower resolution than the remainder of the image".[26]
"Most of the many lakes and seas seen so far are contained in this image, including the largest known body of liquid on Titan. These seas are most likely filled with liquid ethane, methane and dissolved nitrogen."[26]
"Many bays, islands and presumed tributary networks are associated with the seas. The large feature in the upper right center of this image is at least 100,000 square kilometers (40,000 square miles) in area, greater in extent than Lake Superior (82,000 square kilometers or 32,000 square miles), one of Earth's largest lakes. This Titan feature covers a greater fraction of the surface, at least 0.12 percent, than the Black Sea, Earth's largest terrestrial inland sea, at 0.085 percent. Larger seas may exist, as it is probable that some of these bodies are connected, either in areas unmapped by radar or under the surface (see PIA08365)."[26]
"Of the 400 observed lakes and seas, 70 percent of their area is taken up by large "seas" greater than 26,000 square kilometers (10,000 square miles)."[26]
In the second image at right is another radar image of Titan's surface. "The existence of oceans or lakes of liquid methane on Saturn's moon Titan was predicted more than 20 years ago. But with a dense haze preventing a closer look it has not been possible to confirm their presence. Until the Cassini flyby of July 22, 2006, that is."[27]
"Radar imaging data from the flyby, published this week in the journal Nature, provide convincing evidence for large bodies of liquid. This image, used on the journal's cover, gives a taste of what Cassini saw. Intensity in this colorized image is proportional to how much radar brightness is returned, or more specifically, the logarithm of the radar backscatter cross-section. The colors are not a representation of what the human eye would see."[27]
"The lakes, darker than the surrounding terrain, are emphasized here by tinting regions of low backscatter in blue. Radar-brighter regions are shown in tan. The strip of radar imagery is foreshortened to simulate an oblique view of the highest latitude region, seen from a point to its west."[27]
"This radar image was acquired by the Cassini radar instrument in synthetic aperture mode on July 22, 2006. The image is centered near 80 degrees north, 35 degrees west and is about 140 kilometers (84 miles) across. Smallest details in this image are about 500 meters (1,640 feet) across."[27]
Recent history
The recent history period dates from around 1,000 b2k to present.
The "Arecibo telescope was completed in 1963 at the initiative of Cornell electrical engineering professor William E. Gordon "[28]
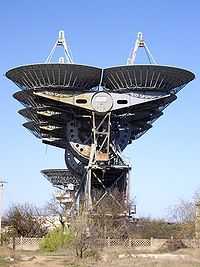
At right is an image of the Pluton radar complex used for radar astronomy since 1960.
Arecibo Observatory
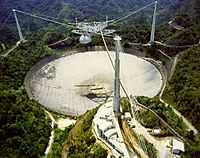
The "Arecibo Observatory in Puerto Rico [is] the world's largest, and most sensitive, single-dish radio telescope."[28]
"The 1,000-foot-diameter (305 meters) Arecibo telescope [... provides] access to state-of-the-art observing for scientists in radio astronomy, solar system radar and atmospheric studies, and the observatory has the unique capability for solar system and ionosphere (the atmosphere's ionized upper layers) radar remote sensing."[28]
"It contains the largest curved focusing dish on Earth, giving Arecibo the largest electromagnetic-wave-gathering capacity.[29] The dish surface is made of 38,778 perforated aluminum panels, each measuring about 3 by 6 feet (1 by 2 m), supported by a mesh of steel cables."[30]
"The telescope has three radar transmitters, with effective isotropic radiated powers [EIRP] of 20 TW at 2380 MHz, 2.5 TW (pulse peak) at 430 MHz, and 300 MW at 47 MHz. The telescope is a spherical reflector, not a parabolic reflector. To aim the telescope, the receiver is moved to intercept signals reflected from different directions by the spherical dish surface. A parabolic mirror would induce a varying astigmatism when the receiver is in different positions off the focal point, but the error of a spherical mirror is the same in every direction."[30]
"The receiver is located on a 900-ton platform which is suspended 150 m (500 ft) in the air above the dish by 18 cables running from three reinforced concrete towers, one of which is 110 m (365 ft) high and the other two of which are 80 m (265 ft) high (the tops of the three towers are at the same elevation). The platform has a 93-meter-long rotating bow-shaped track called the azimuth arm on which receiving antennas, secondary and tertiary reflectors are mounted. This allows the telescope to observe any region of the sky within a forty-degree cone of visibility about the local zenith (between −1 and 38 degrees of declination). Puerto Rico's location near the equator allows Arecibo to view all of the planets in the Solar System, though the round trip light time to objects beyond Saturn is longer than the time the telescope can track it, preventing radar observations of more distant objects."[30]
Goldstone Deep Space Communication Complex
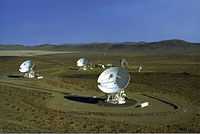
Shown at right are the three "34m (110 ft.) diameter Beam Waveguide antennas located at the Goldstone Deep Space Communications Complex, situated in the Mojave Desert in California. This is one of three complexes which comprise NASA's Deep Space Network (DSN). The DSN provides radio communications for all of NASA's interplanetary spacecraft and is also utilized for radio astronomy and radar observations of the solar system and the universe."[31]
Synthetic Aperture Radar Satellite
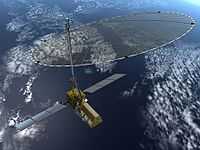
"Using advanced radar imaging that will provide an unprecedented, detailed view of Earth, the NASA-ISRO Synthetic Aperture Radar, or NISAR, satellite is designed to observe and take measurements of some of the planet's most complex processes, including ecosystem disturbances, ice-sheet collapse, and natural hazards such as earthquakes, tsunamis, volcanoes and landslides."[32]
"Data collected from NISAR will reveal information about the evolution and state of Earth's crust, help scientists better understand our planet's processes and changing climate, and aid future resource and hazard management. The mission is a partnership between NASA and the Indian Space Research Organization [ISRO]."[32]
"Scientific Instrument(s) - L-band (24-centimeter wavelength) Polarimetric Synthetic Aperture Radar [JPL] - S-band (12-centimeter wavelength) Polarimetric Synthetic Aperture Radar [ISRO]"[32]
- See also: Original research inquiry and Research
Hypothesis:
- A radar frequency exists that is reflected back by the Sun.
- A control group for radar astronomy would likely contain a standard target that allows maximum radar facility resolution and imaging.
- See also: Control groups, Proof of concept, and Proof of technology
See also
References
- 1 2 3 4 5 6 7 8 9 10 11 "Radar astronomy, In: Wikipedia". San Francisco, California: Wikimedia Foundation, Inc. July 30, 2012. Retrieved 2012-08-30.
- ↑ The Evolution of Radio Astronomy. Histories of Science Series. 1. Paul Elek (Scientific Books). 1973.
- ↑ "Radio waves, In: Wikipedia". San Francisco, California: Wikimedia Foundation, Inc. July 6, 2012. Retrieved 2012-08-29.
- 1 2 3 John W. Holt, Ali Safaeinili, Jeffrey J. Plaut, James W. Head, Roger J. Phillips, Roberto Seu, Scott D. Kempf, Prateek Choudhary, Duncan A. Young, Nathaniel E. Putzig, Daniela Biccari, Yonggyu Gim (November 2008). "Radar Sounding Evidence for Buried Glaciers in the Southern Mid-Latitudes of Mars". Science 322 (5905): 1235-8. doi:10.1126/science.1164246. http://www.sciencemag.org/content/322/5905/1235.full. Retrieved 2014-09-28.
- 1 2 Brian Dunbar (November 29, 2012). "MESSENGER Finds New Evidence for Water Ice at Mercury's Poles". Washington, DC USA: NASA. Retrieved 2013-10-24.
- 1 2 David Lawrence (November 29, 2012). "MESSENGER Finds New Evidence for Water Ice at Mercury's Poles". Washington, DC USA: NASA. Retrieved 2013-10-24.
- 1 2 Gregory Neumann (November 29, 2012). "MESSENGER Finds New Evidence for Water Ice at Mercury's Poles". Washington, DC USA: NASA. Retrieved 2013-10-24.
- ↑ David Paige (November 29, 2012). "MESSENGER Finds New Evidence for Water Ice at Mercury's Poles". Washington, DC USA: NASA. Retrieved 2013-10-24.
- ↑ Steven J. Ostro (October-December 1993). "Planetary radar astronomy". Reviews of Modern Physics 65 (4): 1235-79. doi:10.1103/RevModPhys.65.1235. http://rmp.aps.org/abstract/RMP/v65/i4/p1235_1. Retrieved 2012-02-09.
- ↑ J. Mofensen (February, April 1946). "Radar Echoes from the Moon". Nature, Electronics 157, 19 (3379): 129, 92-8. doi:10.1038/157129b0.
- ↑ Z. Bay, "Reflection of microwaves from the moon," Hung. Acta Phys., vol. 1, pp. 1-22; April, 1946.
- 1 2 3 4 5 P. Spudis (November 6, 2006). "Ice on the Moon". The Space Review. Retrieved 12 April 2007.
- ↑ BatteryIncluded (June 14, 2013). "File:Radar cross section of north polar ice cap of Mars.jpg, In: Wikimedia Commons". San Francisco, California: Wikimedia Foundation, Inc. Retrieved 2013-10-24.
- 1 2 3 Thomas Thompson (September 02, 2013). "Radar Ionogram with Oblique Ionospheric Echo". Pasadena, California USA: NASA. Retrieved 2013-10-24.
- 1 2 3 4 5 6 7 Sue Lavoie (December 13, 2006). "PIA09076: Interpreting Radar View near Mars' South Pole, Orbit 1334". Pasadena, California USA: NASA. Retrieved 2013-10-24.
- 1 2 3 Ian O'Neill (June 22, 2012). "Asteroid 2012 LZ1 Just Got Supersized". Discovery Communications, LLC. Retrieved 2013-10-24.
- ↑ Ellen Howell (June 22, 2012). "Asteroid 2012 LZ1 Just Got Supersized". Discovery Communications, LLC. Retrieved 2013-10-24.
- ↑ Mike Nolan (June 22, 2012). "Asteroid 2012 LZ1 Just Got Supersized". Discovery Communications, LLC. Retrieved 2013-10-24.
- 1 2 Don Savage and Jane Platt (November 27, 1996). "Images of Asteroid 4179 Toutatis". Washington, DC USA: NASA. Retrieved 2013-10-24.
- 1 2 Eric De Jong (November 27, 1996). "Images of Asteroid 4179 Toutatis". Washington, DC USA: NASA. Retrieved 2013-10-24.
- 1 2 Scott Hudson (November 27, 1996). "Images of Asteroid 4179 Toutatis". Washington, DC USA: NASA. Retrieved 2013-10-24.
- 1 2 3 Steven Ostro (November 27, 1996). "Images of Asteroid 4179 Toutatis". Washington, DC USA: NASA. Retrieved 2013-10-24.
- 1 2 Gordon H. Pettengill & Irwin I. Shapiro (1965). "Radar Astronomy". Annual Review of Astronomy and Astrophysics 3: 377-410. http://adsabs.harvard.edu//abs/1965ARA&A...3..377P. Retrieved 2012-12-25.
- ↑ Irwin I. Shapiro (March 1968). "Planetary radar astronomy". Spectrum, IEEE 5 (3): 70-9. doi:10.1109/MSPEC.1968.5214821. http://ieeexplore.ieee.org/xpls/abs_all.jsp?arnumber=5214821. Retrieved 2012-12-25.
- ↑ R. B. Dyce and G. H. Pettengill, and A. D. Sanchez (August 1967). "Radar Observations of Mars and Jupiter at 70 cm". The Astronomical Journal 72 (4): 771-7. doi:10.1086/110307. http://articles.adsabs.harvard.edu/cgi-bin/nph-iarticle_query?1967AJ.....72..771D&data_type=PDF_HIGH&whole_paper=YES&type=PRINTER&filetype=.pdf. Retrieved 2012-12-25.
- 1 2 3 4 5 Sue Lavoie (October 11, 2007). "PIA10008: Titan's North Polar Region". Pasadena, California USA: NASA/JPL. Retrieved 2013-06-13.
- 1 2 3 4 Enrico Piazza (January 3, 2007). "Liquid Lakes on Titan". Pasadena, California USA: NASA/JPL. Retrieved 2013-06-13.
- 1 2 3 David Brand (21 January 2003). "Astrophysicist Robert Brown, leader in telescope development, named to head NAIC and its main facility, Arecibo Observatory". Cornell University. Retrieved 2008-09-02.
- ↑ Frederic Castel (8 May 2000). "Arecibo: Celestial Eavesdropper". Space.com. Archived from the original on 2000-06-19. Retrieved 2008-09-02.
- 1 2 3 "Arecibo Observatory, In: Wikipedia". San Francisco, California: Wikimedia Foundation, Inc. December 8, 2012. Retrieved 2012-12-09.
- ↑ Michael Hahn (January 1, 1990). "Goldstone Deep Space Communication Complex". Washington, DC USA: NASA HQ. Retrieved 2013-10-24.
- 1 2 3 Jon Nelson (2 July 2014). "NASA-ISRO Synthetic Aperture Radar". Pasadena, California USA: NASA/JPL. Retrieved 2015-03-10.
External links
- African Journals Online
- Bing Advanced search
- Google Books
- Google scholar Advanced Scholar Search
- International Astronomical Union
- JSTOR
- Lycos search
- NASA/IPAC Extragalactic Database - NED
- NASA's National Space Science Data Center
- Office of Scientific & Technical Information
- Questia - The Online Library of Books and Journals
- SAGE journals online
- The SAO/NASA Astrophysics Data System
- Scirus for scientific information only advanced search
- SDSS Quick Look tool: SkyServer
- SIMBAD Astronomical Database
- SIMBAD Web interface, Harvard alternate
- Spacecraft Query at NASA.
- SpringerLink
- Taylor & Francis Online
- Universal coordinate converter
- Wiley Online Library Advanced Search
- Yahoo Advanced Web Search
| ||||||||||||||||||||||||||||||||||||||||||||
| |||||||||||||||||||||||||||||||||||
| |||||||||||||||||||||||||||||||||||||||||
| |||||||||||||||||||||||||||||||||||||||||
![]() This is a research project at http://en.wikiversity.org
This is a research project at http://en.wikiversity.org
| |
Resource type: this resource is an article. |
| |
Resource type: this resource contains a lecture or lecture notes. |
| |
Subject classification: this is an astronomy resource. |