Radiation astronomy
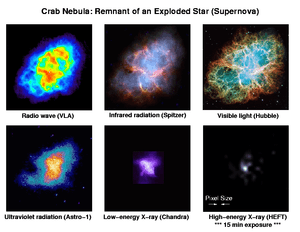
Radiation astronomy is astronomy applied to the various extraterrestrial sources of radiation, especially at night. It is also conducted above the Earth's atmosphere and at locations away from the Earth, by satellites and space probes, as a part of explorational (or exploratory) radiation astronomy.
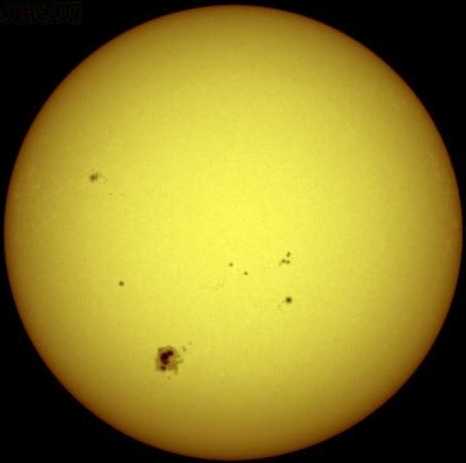
Seeing the Sun and feeling the warmth of its rays is probably a student's first encounter with an astronomical radiation source. This will happen from a very early age, but a first understanding of the concepts of radiation may occur at a secondary educational level.
Radiation is all around us on top of the Earth's crust, regolith, and soil, where we live. The study of radiation, including radiation astronomy, usually intensifies at the university undergraduate level.
And, generally, radiation becomes hazardous, when a student embarks on graduate study.
Cautionary speculation may be introduced unexpectedly to stimulate the imagination and open a small crack in a few doors that may appear closed at present. As such, this learning resource is part lecture and part article as it incorporates some state-of-the-art results from the scholarly literature.
The laboratories of radiation astronomy are limited to the radiation observatories themselves and the computers and other instruments (sometimes off site) used to analyze the results.
Astronomy
A nomy (Latin nomia) is a "system of laws governing or [the] sum of knowledge regarding a (specified) field."[1] Nomology is the "science of physical and logical laws."[1] When any effort to acquire a system of laws or knowledge focusing on an astr, aster, or astro, that is, any natural body in the sky especially at night,[1] succeeds even in its smallest measurement, astronomy is the name of the result.
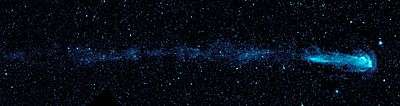
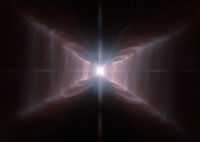
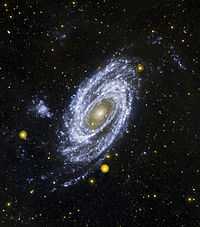
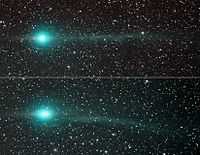
The image on the left shows a high velocity binary star and the comet-like trail behind it is light years long. The binary is plowing through the interstellar medium. It's radiating, been radiated, and packs a punch!
Radiation
“In physics, radiation is a process in which energetic particles or energetic waves travel through a medium or space.”[2]
Def. an action or process of throwing or sending out a traveling ray of energy in a line, beam, or stream of small cross section is called radiation.
Def. “[t]he shooting forth of anything from a point or surface, like the diverging rays of light”[3] is called radiation.
The term radiation is often used to refer to the ray itself.
“Different types of ionizing radiation behave in different ways, so different shielding techniques are used."[4]
Planetary science
"Planetary science ... is the scientific study of planets (including Earth), [Natural satellite] moons, and planetary systems, in particular those of the solar system and the processes that form them [using the radiation they emit, reflect, fluoresce, or absorb]. It studies objects ranging in size from micrometeoroids to gas giants, aiming to determine their composition, dynamics, formation, interrelations and history. It is a strongly interdisciplinary field, originally growing from astronomy and earth science,[5] but which now incorporates many disciplines, including planetary astronomy, planetary geology (together with geochemistry and geophysics), atmospheric science, oceanography, hydrology, theoretical planetary science, glaciology, and the study of extrasolar planets.[5]"[6]
Colors
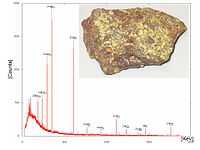
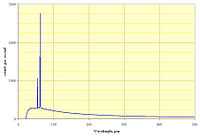
The peak at 40 keV is not from the mineral. From the color of the rock shown the yellowish mineral is likely to be autunite.
Autunite "occurs as [an] oxidizing product of uranium minerals in granite pegmatites and hydrothermal deposits."[7]
Minerals
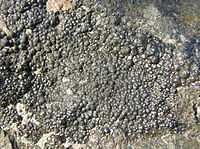
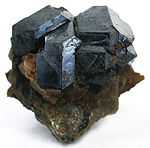
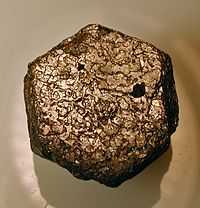
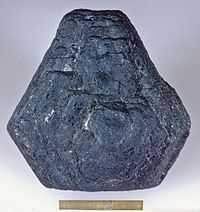
"Uraninite is a radioactive, uranium-rich mineral and ore with a chemical composition that is largely [uranium dioxide] UO2, but also contains [uranium trioxide] UO3 and oxides of lead, thorium, and rare earth elements. It is most commonly known as pitchblende (from pitch, because of its black color ... All uraninite minerals contain a small amount of radium as a radioactive decay product of uranium. Uraninite also always contains small amounts of the lead isotopes 206Pb and 207Pb, the end products of the decay series of the uranium isotopes 238U and 235U respectively. ... The extremely rare element technetium can be found in uraninite in very small quantities (about 0.2 ng/kg), produced by the spontaneous fission of uranium-238."[8]
The image at left shows well-formed crystals of uraninite. The image at right shows botryoidal uraninite. Because of the uranium decay products, both sources are gamma-ray emitters.
Theoretical astronomy
Theoretical astronomy at its simplest is the definition of terms to be applied to astronomical entities, sources, and objects.
Def. an "expanse of space that seems to be [overhead] like a dome"[1] is called a sky.
Computer simulations are usually used to represent astronomical phenomena.
Part of the fun of theory is extending the known to what may be known to see if knowing is really occurring, or is it something else.
The laboratories of astronomy are limited to the observatories themselves. The phenomena observed are located in the heavens, far beyond the reach, let alone control, of the astronomical observer.[9] “So how can one be sure that what one sees out there is subject to the same rules and disciplines of science that govern the local laboratory experiments of physics and chemistry?”[9] “The most incomprehensible thing about the universe is that it is comprehensible.” - Albert Einstein.[9]
Theoretical radiation astronomy
At its simplest theoretical radiation astronomy is the definition of terms to be applied to astronomical radiation phenomena.
Def. a theory of the science of the biological, chemical, physical, and logical laws (or principles) with respect to any natural radiation source in the sky especially at night is called theoretical radiation astronomy.
Exploratory theory is the playtime activity that leads to discoveries which better our world. In the radiation physics laboratories here on Earth, the emission, reflection, transmission, absorption, and fluorescence of radiation is studied and laws relative to sources are proven.
"A principle is a law or rule that has to be, or usually is to be followed, or can be desirably followed, or is an inevitable consequence of something, such as the laws observed in nature or the way that a system is constructed. The principles of such a system are understood by its users as the essential characteristics of the system, or reflecting system's designed purpose, and the effective operation or use of which would be impossible if any one of the principles was to be ignored.[10]"[11]
Radiation astronomy consists of three fundamental parts:
- derivation of logical laws with respect to incoming radiation,
- natural radiation sources outside the Earth, and
- the sky and associated realms with respect to radiation.
Def. a spontaneous emission of an α ray, β ray, or γ ray by the disintegration of an atomic nucleus is called radioactivity.[1]
Entities
Astronomical X-ray entities are often discriminated further into sources or objects when more information becomes available, including that from other radiation astronomies.
A researcher who turns on an X-ray generator to study the X-ray emissions in a laboratory so as to understand an apparent astronomical X-ray source is an astronomical X-ray entity. So is one who writes an article about such efforts or a computer simulation to possibly represent such a source.
"The X-ray luminosity of the dominant group [an entity] is an order of magnitude fainter than that of the X-ray jet."[12]
Sources
In source astronomy, the question is "Where did it come from?"
Source astronomy has its origins in the actions of intelligent life on Earth when they noticed things or entities falling from above and became aware of the sky. Sometimes what they noticed is an acorn or walnut being dropped on them or thrown at them by a squirrel in a tree. Other events coupled with keen intellect allowed these life forms to deduce that some entities falling from the sky are coming down from locations higher than the tops of local trees.
Def. a source or apparent source detected or “created at or near the time of the [ event or] events” is called a primary source.
Direct observation and tracking of the origination and trajectories of falling entities such as volcanic bombs presented early intelligent life with vital albeit sometimes dangerous opportunities to compose the science that led to source astronomy.
Objects
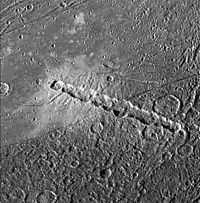
Def. "[a] hemispherical pit ... [a] basinlike opening or mouth ... about which a cone is often built up ... any large roughly circular depression or hole"[13] is called a crater.
The image at right shows a chain of 13 craters (Enki Catena) on Ganymede measuring 161.3 km in length. "The Enki craters formed across the sharp boundary between areas of bright terrain and dark terrain, delimited by a thin trough running diagonally across the center of this image. The ejecta deposit surrounding the craters appears very bright on the bright terrain. Even though all the craters formed nearly simultaneously, it is difficult to discern any ejecta deposit on the dark terrain."[14]
Strong forces
"In field theory it is known that coupling constants “run”. This means that the values of the coupling constants that one measures depend on the energy at which the measurement is performed. [...] the three different coupling constants [one each for the strong force, electromagnetic force, and the weak force] of the standard model seem to converge to the same value at an energy scale of about 1016 GeV [...] This suggests that there is only one coupling constant at high energies and most likely only one symmetry group. [...] The current belief [is] that the electromagnetic, weak and strong forces [are] unified at about 1016 GeV [as such] one has to rely on [the] particle physics interactions which can lead to electromagnetic radiation and cosmic rays".[15]
Electromagnetics
"The emission of electromagnetic radiation from a superluminal (faster-than-light in vacuo) charged particle [is such] that no physical principle forbids emission by extended, massless superluminal sources. A polarization current density (dP/dt; see Maxwell's fourth equation) can provide such a source; the individual charged particles creating the polarization do not move faster than c, the speed of light, and yet it is relatively trivial to make the envelope of the polarization current density to do so."[16]
The "emitted radiation has many unusual characteristics, including: (i) the intensity of some components decays as the inverse of the distance from the source, rather than as 1/(distance)2 (i.e. these components are non-spherically-decaying); (ii) the emission is tightly beamed, the exact direction of the beam depending on the source speed; and (iii) the emission contains very high frequencies not present in the synthesis of the source. Note that the non-spherically decaying components of the radiation do not violate energy conservation. They result from the reception, during a short time period, of radiation emitted over a considerably longer period of (retarded) source time; their strong electromagnetic fields are compensated by weak fields elsewhere [1]."[16]
The "emission occupies a very small polar angular width of order 0.8 degrees in the far field. Based on these findings, we suggest that a superluminal source could act as a highly directional transmitter of MHz or THz signals over very long distances."[16]
"The magnetic field is well-ordered in many jets, as shown by polarization measurements. Synchrotron radiation can be very highly polarized (50%) if the field is globally ordered, and some sources [approach] this level. The electric vectors show clear structure and alignment; an especially common pattern is for the field lines to be along the jet in the inner portions and transition to an azimuthal configuration farther out. This is seen in [PKS0521-36 at 2 cm]."[17]
Weak forces
"The observation of a neutrino burst within 3 h of the associated optical burst from supernova 1987A in the Large Magellanic Cloud provides a new test of the weak equivalence principle, by demonstrating that neutrinos and photons follow the same trajectories in the gravitational field of the galaxy."[18]
Continuum
"Lyc photon or Ly continuum photon or Lyman continuum photon are a kind of photon emitted from stars. Hydrogen is ionized by absorption of Lyc photons. Lyc photons are in the ultraviolet portion of the electromagnetic spectrum of the hydrogen atom and immediately next to the limit of the Lyman series of the spectrum with wavelengths that are shorter than 91.1267 nanometres and with energy above 13.6 eV."[19]
Emissions
"[T]he extended red emission (ERE) [is] observed in many dusty astronomical environments, in particular, the diffuse interstellar medium of the Galaxy. ... silicon nanoparticles provide the best match to the spectrum and the efficiency requirement of the ERE."[20]
Absorptions
"For quenched galaxies, the Hα absorption trough is deep and can be traced through the nucleus and along the major axis. It extends to a radius at or beyond 2 Rd [where Rd is the galaxy disk scale length] in all but three cases. This makes it possible to determine a velocity width from the optical spectrum as is done for emission line flux, with appropriate corrections between stellar and gas velocities (see discussion in Paper I, also Neistein, Maoz, Rix, & Tonry, 1999). In the few cases where a velocity width can also be measured from the H I data, it is found to be in good agreement with that taken from the Hα absorption line flux."[21]
Bands
"The Sun's emission in the lowest UV bands, the UVA, UVB, and UVC bands, are of interest, as these are the UV bands commonly encountered from artificial sources on Earth. The shorter bands of UVC, as well as even more energetic radiation as produced by the Sun, generate the ozone in the ozone layer when single oxygen atoms produced by UV photolysis of dioxygen react with more dioxygen. The ozone layer is especially important in blocking UVB and part of UVC, since the shortest wavelengths of UVC (and those even shorter) are blocked by ordinary air."[22]
Backgrounds
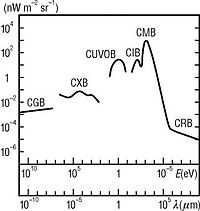
In the figure at right, CUVOB stands for the cosmic ultraviolet and optical background. "The diffuse extragalactic background light (EBL) is all the accumulated radiation in the Universe due to star formation processes, plus a contribution from active galactic nuclei (AGNs). This radiation covers the wavelength range between ~ 0.1-1000 microns (these are the ultraviolet, optical, and infrared regions of the electromagnetic spectrum). The EBL is part of the diffuse extragalactic background radiation (DEBRA), which by definition covers the overall electromagnetic spectrum. After the cosmic microwave background, the EBL produces the second-most energetic diffuse background, thus being essential for understanding the full energy balance of the universe."[23]
Meteors
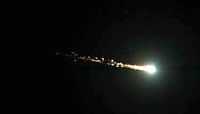
"A meteor is the visible path of a meteoroid that has entered the Earth's atmosphere."[24]
Although there are many definitions of a meteor ranging from "[a]ny atmospheric phenomenon"[25] to "[a] fast-moving streak of light in the night sky caused by the entry of extraterrestrial matter into the earth's atmosphere: A shooting star or falling star"[25], for radiation astronomy, an alternative definition is used.
Here's a theoretical definition of a meteor from a radiation point of view:
Def. any natural object radiating through a portion or all of the Earth's or another natural object's atmosphere is called a meteor.
A hypervelocity star "snow-plowing" through the interstellar medium of a galaxy is a meteor and the subject of meteor astronomy.
Meteor astronomy (radiated meteors) is radiation astronomy of large matter objects moving rapidly relative to apparently fixed objects.
A meteor may be as small as an electron. Astronomical objects that are atoms, nuclei, or subatomic particles are part of cosmic-ray astronomy.
Cosmic rays
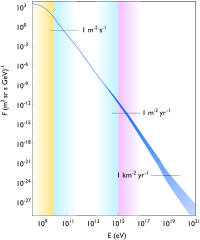
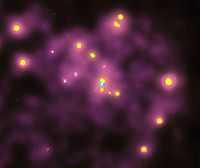
At right is an image indicating the range of cosmic-ray energies. The flux for the lowest energies (yellow zone) is mainly attributed to solar cosmic rays, intermediate energies (blue) to galactic cosmic rays, and highest energies (purple) to extragalactic cosmic rays.[26]
There is "a correlation between the arrival directions of cosmic rays with energy above 6 x 10¹⁹ electron volts and the positions of active galactic nuclei (AGN) lying within ~75 megaparsecs."[27]
"[T]he Oh-My-God particle [was] observed on the evening of 15 October 1991 over Dugway Proving Ground, Utah. Its observation was a shock to astrophysicists, who estimated its energy to be approximately 3×10²⁰
eV[28](50 joules)—in other words, a subatomic particle with kinetic energy equal to that of a baseball (142 g or 5 oz) traveling at 100 km/h (60 mph)."[29]
"It was most probably a proton with a speed very close to the speed of light, so close, in fact, [(1 − 5×10⁻²⁴
) × c], that in a year-long race between light and the cosmic ray, the ray would fall behind only 46 nanometers (5×10⁻²⁴
light-years), or 0.15 femtoseconds (1.5×10⁻¹⁶
s).[30]"[29]
Neutrals
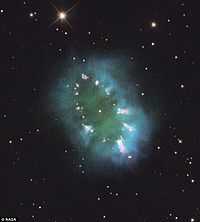
"A giant cosmic necklace glows brightly in this Nasa Hubble Space Telescope image."[31]
"The object, aptly named the Necklace Nebula, is a recently discovered planetary nebula, the glowing remains of an ordinary, sun-like star."[31]
"The nebula consists of a bright ring, measuring 12trillion miles wide, dotted with dense, bright knots of gas that resemble diamonds in a necklace."[31]
"Newly discovered: The Necklace Nebula glows brightly in this composite image taken by the Hubble Space Telescope last month. The glow of hydrogen, oxygen, and nitrogen are shown by the colours blue, green and red respectively".[31]
"It is located 15,000 light-years away in the constellation Sagitta."[31]
"A pair of stars orbiting close together produced the nebula, also called PN G054.2-03.4."[31]
"About 10,000 years ago, one of the ageing stars ballooned to the point where it engulfed its companion star. The smaller star continued orbiting inside its larger companion, increasing the giant’s rotation rate. The bloated companion star spun so fast that a large part of its gaseous envelope expanded into space. Due to centrifugal force, most of the gas escaped along the star’s equator, producing a ring. The embedded bright knots are dense gas clumps in the ring. The pair is so close, only a few million miles apart, that they appear as one bright dot in the centre. The stars are furiously whirling around each other, completing an orbit in a little more than a day."[31]
Subatomics
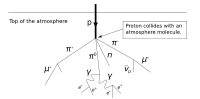
An "analysis of the energy-loss distributions in the GRS HEM during the impulsive phase of this event indicates that γ-rays from the decay of π0 mesons were detected [...] The production of pions, which is accompanied (on average) by neutrons, has an energy threshold of ~290 MeV for p-p and ~180 MeV for p-α interactions, giving, therefore, a lower limit to the maximum energy of the particles accelerated at the Sun."[32]
Neutrons
Around EeV (1018 eV) energies, there may be associated ultra high energy neutrons "observed in anisotropic clustering ... because of the relativistic neutrons boosted lifetime."[33] “[A]t En = 1020 eV, [these neutrons] are flying a Mpc, with their directional arrival (or late decayed proton arrival) ... more on-line toward the source.”[33] From “neutron (and anti-neutron) life-lengths (while being marginal or meaningless at tens of Mpcs)", the growth of their half-lives with energy may naturally explain an associated, showering neutrino halo.[33]
Fairly large fluxes of neutrons have been observed during solar flares such as that of November 12, 1960, with a flux of 30-70 neutrons per cm-2 s-1.[34]
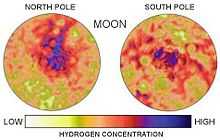
At right is the result of an all Moon survey by the Lunar Prospector using an onboard neutron spectrometer (NS). Cosmic rays impacting the lunar surface generate neutrons which in turn lose much of their energy in collisions with hydrogen atoms trapped within the Moon's surface.[35] Some of these thermal neutrons collide with the helium atoms within the NS to yield an energy signature which is detected and counted.[35] The NS aboard the Lunar Prospector has a surface resolution of 150 km.[35]
Protons
"Proton astronomy should be possible; it may also provide indirect information on inter-galactic magnetic fields."[36]
Proton astronomy per se often consists of directly or indirectly detecting the protons and deconvoluting a spatial, temporal, and spectral distribution.
“[A]t the high end of the proton energy spectrum (above ≈ 1018 eV) [the Larmor radius] deflection becomes small enough that proton astronomy becomes possible.”[37]
"The third largest solar proton event in the past thirty years took place during July 14-16, 2000, and had a significant impact on the earth's atmosphere."[38]
Beta particles
"Beta particles are high-energy, high-speed electrons or positrons".[39]
Beta particles may be the key to fusion. "If the exterior of the capsule is maintained at a uniform temperature of about 19.5 K, the natural beta decay energy of the tritium will accomplish this through a process known as "beta layering." The very low energy beta particles from tritium decay deposit their energy very close to the location of the original tritium atoms."[40]
"Beta-particles leaving the upper surface of the lunar sample could trigger the upper beta detector, while the lower beta-detector was triggered by beta particles from the lower surface of the sample."[41]
Notation: let the symbol β− designate an unbound electron in motion.
Notation: let β+ designate an unbound positron in motion.
Electrons
Although electron astronomy is usually not recognized as a formal branch of astronomy, the measurement of electron fluxes help to understand a variety of natural phenomena.
Particles such as electrons are used as tracers of cosmic magnetic fields.[43] "From a plasma-physics point of view, the particles represent the correct way to identify magnetic field lines."[43] "The suprathermal electrons in the solar wind and in solar particle events have excellent properties for this application: they move rapidly, they remain tightly bound to their field lines, and they may arrive "scatter-free" even at low energies, and from deep in the solar atmosphere (Lin 1985)."[43] These electrons "provide remote-sensing observations of distant targets in the heliosphere - the Sun, the Moon, Jupiter, and various heliospheric structures."[43] ""[E]lectron astronomy" has an interesting future".[43]
"A delta ray is characterized by very fast electrons produced in quantity by alpha particles or other fast energetic charged particles knocking orbiting electrons out of atoms. Collectively, these electrons are defined as delta radiation when they have sufficient energy to ionize further atoms through subsequent interactions on their own."[44]
"The conventional procedure of delta-ray counting to measure charge (Powell, Fowler, and Perkins 1959), which was limited to resolution σz = 1-2 because of uncertainties of the criterion of delta-ray ranges, has been significantly improved by the application of delta-ray range distribution measurements for 16O and 32S data of 200 GeV per nucleon (Takahashi 1988; Parnell et al. 1989)."[45] Here, the delta-ray tracks in emulsion chambers have been used for "[d]irect measurements of cosmic-ray nuclei above 1 TeV/nucleon ... in a series of balloon-borne experiments".[45]
Positrons
"Positron astronomy is 30 years old but remains in its infancy."[46]
"[P]ositron astronomy results ... have been obtained using the INTEGRAL spectrometer SPI".[47] The positrons are not directly observed by the INTEGRAL space telescope, but "the 511 keV positron annihilation emission is".[47]
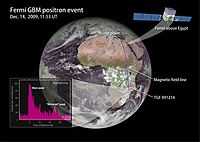
During solar flares “[s]everal radioactive nuclei that emit positrons are also produced; [which] slow down and annihilate in flight with the emission of two 511 keV photons or form positronium with the emission of either a three gamma continuum (each photon < 511 keV) or two 511 keV photons."[48]
Muons
"TeV muons from γ ray primaries ... are rare because they are only produced by higher energy γ rays whose flux is suppressed by the decreasing flux at the source and by absorption on interstellar light."[36]
"Muon decay produces three particles, an electron plus two neutrinos of different types."[49]
Neutrinos
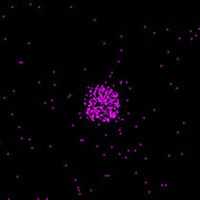
“The field of neutrino astronomy is still very much in its infancy – the only confirmed extraterrestrial sources so far are the Sun and supernova SN1987A.”[50] Neutrino astronomy “observes astronomical objects with neutrino detectors in special observatories.”[51]
“Because neutrinos are only weakly interacting with other particles of matter, neutrino detectors must be very large in order to detect a significant number of neutrinos. Neutrino detectors are often built underground to isolate the detector from cosmic rays and other background radiation.[52]”[50]
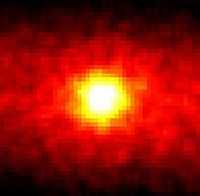
The Super-Kamiokande, or "Super-K" is a large-scale experiment constructed in an unused mine in Japan to detect and study neutrinos. The image at right required 500 days worth of data to produce the "neutrino image" of the Sun. The image is centered on the Sun's position. This image covers a 90° x 90° octant of the sky (in right ascension and declination). The higher the brightness of the color, the larger is the neutrino flux.
Gamma rays
"Most astronomical gamma-rays are thought to be produced not from radioactive decay, however, but from the same type of accelerations of electrons, and electron-photon interactions, that produce X-rays in astronomy (but occurring at a higher energy in the production of gamma-rays)."[53]
For gamma-ray astronomy, "the Vela satellites were the first devices ever to detect cosmic gamma ray bursts."[54]
"Gamma-ray bursts (GRBs) are flashes of gamma rays associated with extremely energetic explosions that have been observed in distant galaxies. They are the most luminous electromagnetic events known to occur in the universe. Bursts can last from ten milliseconds to several minutes, although a typical burst lasts 20–40 seconds. The initial burst is usually followed by a longer-lived "afterglow" emitted at longer wavelengths (X-ray, ultraviolet, optical, infrared, microwave and radio).[55]"[56]
X-rays
X-rays are electromagnetic radiation from a portion of the wavelength spectrum of about 5 to 8 nanometers (nm)s down to approximately 5 to 8 picometers (pm)s (ranging over three orders of magnitude).
An astronomical X-ray source may have one or more positional locations, plus associated error circles or boxes, from which incoming X-radiation (X-rays) has been detected.
Generally, a coronal cloud, a cloud composed of plasma, is usually associated with a star or other celestial or astronomical body, extending sometimes millions of kilometers into space, or thousands of light-years, depending on the associated body. The high temperature of the coronal cloud gives it unusual spectral features. These features have been traced to highly ionized atoms of elements such as iron which indicate a plasma's temperature in excess of 106 K (MK) and associated emission of X-rays.
The importance of X-ray astronomy is exemplified in the use of an X-ray imager such as the one on GOES 14 for the early detection of solar flares, coronal mass ejections (CME)s and other X-ray generating phenomena that impact the Earth.
Ultraviolets
"Ultraviolet astronomy is generally used to refer to observations of electromagnetic radiation at ultraviolet]] wavelengths between approximately 10 and 320 nanometres".[57]
There are many important spectral lines in these wavelengths. Among the most important are the Lyman lines, which are emitted or absorbed when an electron jumps to or from the innermost electron shell in a hydrogen atom. The first three (known as alpha, beta and gamma) have wavelengths of 121.52, 102.53 and 97.22 nm respectively.[58]
Since the Earth's atmosphere strongly absorbs ultraviolet light, especially the shorter wavelengths, ultraviolet astronomy is mostly conducted by satellites. Longer wavelengths can be detected from baloons launched into the stratosphere.
Like the English astronomer William Fox, "In the summer of 1980, reflecting his age, Walter Scott Houston finally underwent surgery to remove a cataract from his right eye. Now to just about anyone else, a cataract would spell the end of a sky gazing career. But not Houston. With his lens removed and a plastic UV-transparent replacement implanted, Scotty reported that a whole new world of star gazing was opened up. The flood of ultraviolet light onto his retina allowed him to see faint blue stars previously invisible by at least one magnitude above the visual limit (to normally sighted observers)."[59]
Opticals
Optical astronomy includes those portions of ultraviolet, visual, and infrared astronomy that benefit from the use of quartz crystal or silica glass telescope components.
"Observations at these wavelengths generally use optical components (mirrors, lenses and solid state digital detectors)."[60]
"In popular culture optical astronomy encompasses a wide variety of observations via telescopes that are sensitive in the range of visible light. Scientists would call this visible-light astronomy. It includes imaging, where a picture of some sort is made of the object; photometry, where the amount of light coming from an object is measured, spectroscopy, where the distribution of that light with respect to its wavelength is measured, and polarimetry where the polarisation state of that light is measured."[60]
Def. "[a]stronomy using infrared, visible and/or ultraviolet wavelengths"[61] is called optical astronomy.
Def. "[a]n optical system in telescopes that reduces atmospheric distortion by dynamically measuring and correcting wavefront aberrations in real time, often by using a deformable mirror"[62] is called adaptive optics.
"Already it has allowed ground-based telescopes to produce images with sharpness rivalling those from the Hubble Space Telescope. The technique is expected to revolutionize the future of ground-based optical astronomy."[63]
"[T]he color index is a simple numerical expression that determines the color of an object, which in the case of a star gives its temperature. To measure the index, one observes the magnitude of an object successively through two different filters, such as U and B, or B and V, where U is sensitive to ultraviolet rays, B is sensitive to blue light, and V is sensitive to visible (green-yellow) light (see also: UBV system). The set of passbands or filters is called a photometric system. The difference in magnitudes found with these filters is called the U-B or B–V color index, respectively. The smaller the color index, the more blue (or hotter) the object is. Conversely, the larger the color index, the more red (or cooler) the object is. This is a consequence of the logarithmic magnitude scale, in which brighter objects have smaller (more negative) magnitudes than dimmer ones. For comparison, the yellowish Sun has a B–V index of 0.656 ± 0.005,[64] while the bluish Rigel has B–V –0.03 (its B magnitude is 0.09 and its V magnitude is 0.12, B–V = –0.03).[65] The passbands most optical astronomers use are the UBVRI filters, where the U, B, and V filters are as mentioned above, the R filter passes red light, and the I filter passes infrared light. ... These filters were specified as particular combinations of glass filters and photomultiplier tubes."[66]
"An optical telescope gathers and focuses light mainly from the visible part of the electromagnetic spectrum (although some work in the infrared and ultraviolet).[67]"[68]
Visuals
“I think everyone can conjure up a mental image of astronomers at every level and place in history, gazing through the eyepieces of their telescopes at sights far away - true visual astronomy.”[69]
| | ||
|---|---|---|
| Color | Frequency | Wavelength |
| violet | 668–789 THz | 380–450 nm |
| blue | 631–668 THz | 450–475 nm |
| cyan | 606–630 THz | 476–495 nm |
| green | 526–606 THz | 495–570 nm |
| yellow | 508–526 THz | 570–590 nm |
| orange | 484–508 THz | 590–620 nm |
| red | 400–484 THz | 620–750 nm |
"The visible spectrum is the portion of the electromagnetic spectrum that is [visual perception] visible to (can be detected by) the human eye. Electromagnetic radiation in this range of wavelengths is called visible light or simply light. A typical human eye will respond to wavelengths from about 390 to 750 nm.[70] In terms of frequency, this corresponds to a band in the vicinity of 400–790 [terahertz] THz. A light-adapted eye generally has its maximum sensitivity at around 555 [nanometre] nm (540 THz), in the green region of the optical spectrum (see: luminosity function)."[71]
There are several cases of astronomers who claimed that following a cataract operation, they could see shorter wavelengths than other people, slightly into the ultraviolet.
Violets
"The aluminium abundance was derived from the resonance line at 394.4nm, and Al is underabundant by ∼ −0.7 dex with respect to iron."[72] "These abundances are the LTE values; no NLTE corrections, as prescribed by Baum ̈uller and Gehren (1997) and Baumüller et al. (1998), have been applied. The prescribed NLTE corrections for Teff = 6500K, log g = 4.0, [Fe/H] = –3.0 are –0.11 ... for ... Al .... If we assume these values to apply for our lower-gravity star [CS 29497-030], then Al follows iron"[72]. The elemental abundance ratios for CS 29497-030 of aluminum are [Al/H] = -3.37, [Al/Fe] = -0.67.[72]
A discovery in violet astronomy is that "carbon stars are enormously fainter in the violet region than expected from appropriate blackbody spectra."[73]
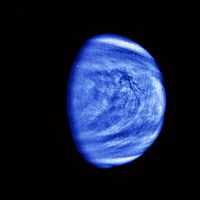
Violet photographs of the planet Venus taken in 1927 “recorded two nebulous bright streaks, or bands, running ... approximately at right angles to the terminator” that may be from the upper atmosphere.[74]
"The “Purple Haze” is a diffuse blueish/purple glow within a few arcseconds of the central star in HST images of the Homunculus (Morse et al. 1998; Smith et al. 2000, 2004). This emission is seen in excess of violet starlight scattered by dust, and the strength of the excess increases into the far UV (Smith et al. 2004; hereafter Paper I)."[75]
Blues
Blue astronomy is focused on the wavelength range 450-475 nm.
Stars are often referred to by their predominant color. For example, blue stragglers are found among the galactic halo globular clusters.[76] Blue main sequence stars that are metal poor ([Fe/H] ≤ -1.0) are most likely very different in origin from blue stragglers.[76]
"[G]round-based UV [and blue astronomy] is a powerful facility for [the] study of [the] chemical evolution of [the] early Galaxy."[77] UV and B astronomy use radiation over the wavelength range 355.0-500.0 nm.[77]
“To date, all of the reported hypervelocity stars (HVSs), which are believed to be ejected from the Galactic center, are blue and therefore almost certainly young.”[78]
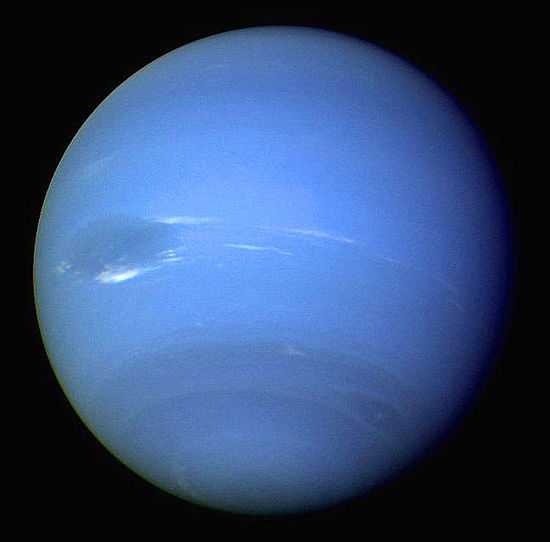
"A trace amount of methane is also present. Prominent absorption bands of methane occur at wavelengths above 600 nm, in the red and infrared portion of the spectrum. As with Uranus, this absorption of red light by the atmospheric methane is part of what gives Neptune its blue hue,[79] although Neptune's vivid azure differs from Uranus's milder cyan. Since Neptune's atmospheric methane content is similar to that of Uranus, some unknown atmospheric constituent is thought to contribute to Neptune's colour.[80]"[81]
Cyans
Perhaps the most prominent cyan planetary source is Uranus, which has only been visited by the space probe Voyager 2. More recent images come from the Hubble Space Telescope in orbit around Earth.
"Methane possesses prominent absorption bands in the visible and near-infrared (IR) making Uranus aquamarine or cyan in color.[82]"[83]
“During the Halley Monitoring Program at La Silla from Feb.17 to Apr.17,1986 ... In the light of the neutral CN-radical a continuous formation and expansion of [cyan] gas-shells could be observed.”[84] “The gas-expansion velocity decreases with increasing heliocentric distance from 1 km/s in early March to 0.8 km/s in April.”[84]
Shown at right, "Lulin's green color comes from the gases that make up its Jupiter-sized atmosphere. Jets spewing from the comet's nucleus contain cyanogen (CN: a poisonous gas found in many comets) and diatomic carbon (C2). Both substances glow green when illuminated by sunlight"[85]
“The electric blue glow of electricity results from the spectral emission of the excited ionized atoms (or excited molecules) of air (mostly oxygen and nitrogen) falling back to unexcited states, which happens to produce an abundance of electric blue light. This is the reason electrical sparks in air, including lightning, appear electric blue. It is a coincidence that the color of Cherenkov radiation and light emitted by ionized air are a very similar blue despite their very different methods of production.”[86]
Greens
Green objects or emission lines in the green portion of the visible spectrum are the subject of green astronomy.
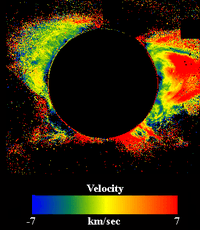
In the image at right the iron (Fe XIV) green line is followed by doppler imaging to show associated relative coronal plasma velocity towards (-7 km/s side) and away from (+7 km/s side) the large angle spectrometric coronagraph LASCO satellite camera.
"Carroll and McCormack (1972) in Dublin reported complex spectra in the blue and green wavelength regions of both FeH and FeD".[85]
For elongated dust particles in cometary comas an investigation is performed at 535.0 nm (green) and 627.4 nm (red) peak transmission wavelengths of the Rosetta spacecraft's OSIRIS Wide Angle Camera broadband green and red filters, respectively.[87] "In the green, the polarization of the pure silicate composition qualitatively appears a better fit to the shape of the observed polarization curves".[87] "[B]ut they are characterized by a high albedo."[87] The silicates used to model the cometary coma dust are olivene (Mg-rich is green) and the pyroxene, enstatite.[87]
"In December 2006, seven papers were published in the scientific journal, Science, discussing initial details of the sample analysis. Among the findings are: a wide range of organic compounds, including two that contain biologically usable nitrogen; indigenous aliphatic hydrocarbons with longer chain lengths than those observed in the diffuse interstellar medium; abundant amorphous silicates in addition to crystalline silicates such as olivine and pyroxene, proving consistency with the mixing of solar system and interstellar matter, previously deduced spectroscopically from ground observations;[88] hydrous silicates and carbonate minerals were found to be absent, suggesting a lack of aqueous processing of the cometary dust; limited pure carbon (CHON) was also found in the samples returned; methylamine and ethylamine was found in the aerogel but was not associated with specific particles."[89]
Yellows
During the limb flares of December 18, 1956, a coronal line at 569.4 nm, a yellow line, occurred at 1822 UTC, 1900 UTC, undiminished up to 20,000 km above the solar limb, and at 2226 UTC, is identified as Ca XV.[90] "The coronal temperature was 4000000°."[90] "The December 18, 1956, flare appears to have been a violent condensation of material from a dense coronal cloud above an active region."[90]
Sodium produces two spectral lines known as D1 and D2, or the "sodium doublet". Their average wavelength, 589.3 nm, is often just called "D".
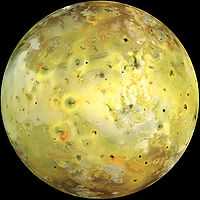
Io "is the innermost of the four Galilean moons of the planet Jupiter and, with a diameter of 3,642 kilometres (2,263 mi), the fourth-largest moon in the Solar System. ... With over 400 active volcanoes, Io is the most geologically active object in the Solar System.[91][92] ... Most of Io's surface is characterized by extensive plains coated with sulfur and sulfur dioxide frost. ... Io's volcanism is responsible for many of the satellite's unique features. Its volcanic plumes and lava flows produce large surface changes and paint the surface in various shades of yellow, red, white, black, and green, largely due to allotropes and compounds of sulfur."[93]
Oranges
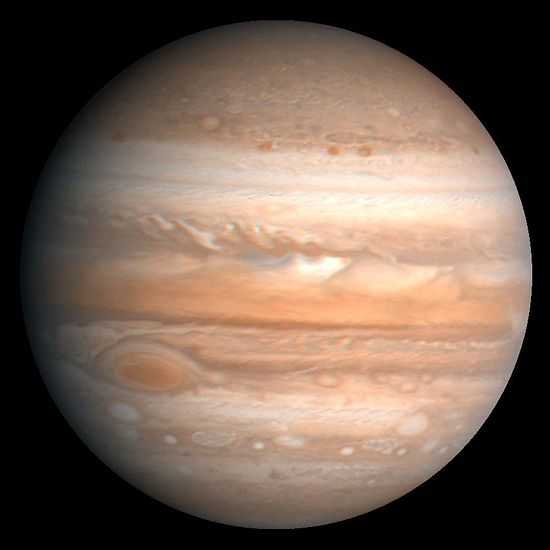
"[O]range [is] the color of Jupiter"[94].
"The orange and brown coloration in the clouds of Jupiter are caused by upwelling compounds that change color when they are exposed to ultraviolet light from the Sun. The exact makeup remains uncertain, but the substances are believed to be phosphorus, sulfur or possibly hydrocarbons.[95][96] These colorful compounds, known as chromophores, mix with the warmer, lower deck of clouds. The zones are formed when rising convection cells form crystallizing ammonia that masks out these lower clouds from view.[97]".[98]
The orange system [in orange astronomy] is a number of emission lines very close together forming a band in the orange portion of the visible spectrum. These lines are usually associated with particular molecular species, including ScO, YO, and TiO.[99]
The orange band from molecular CaCl is "observed in the spectra of many carbon stars."[100]
The Fe VII emission line at 608.7 nm, "frequently observed in the spectra of astrophysical plasmas", has been detected in planetary nebulae, Seyfert galaxies, and quasars.[101]
Reds
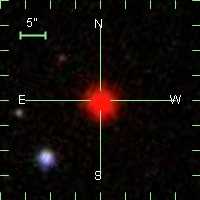
With respect to the color 'red', there are studies of the redness of objects such as the red dwarf AZ Cancri shown in the visual image at right. Cool stars of spectral class M appear red; they are (depending on their size) referred to as "red giants" or "red dwarfs".
"Ideally all intrinsic colours should be found from unreddened stars. This is possible for dwarf and giant stars later than about A0 (Johnson, 1964) ... However, it cannot be used for stars of other spectral classes since they are all relatively infrequent in space, and generally reddened."[102]
A very important wavelength in this region is the Balmer alpha line, 656.28 nm. It is emitted or absorbed by hydrogen atoms when electrons move between the second and third electron shells. Other Balmer lines, known as beta, gamma and delta, have wavelengths of 486.13, 434.05 and 410.17 nm respectively; these are also in the visual range but are less important than the alpha line.
Infrareds
"The wavelength of infrared light ranges from 0.75 to 300 micrometers. Infrared falls in between visible radiation, which ranges from 380 to 750 nanometers, and [terahertz radiation] submillimeter waves."[103]
"Infrared and optical astronomy are often practiced using the same telescopes, as the same mirrors or lenses are usually effective over a wavelength range that includes both visible and infrared light."[103]
"Far-infrared astronomy ... deals with objects visible in far-infrared radiation (extending from 30 [micron] µm towards submillimeter wavelengths around 450 µm)."[104]
"Huge, cold clouds of gas and dust in [the Milky Way] our own galaxy, as well as in nearby galaxies, glow in far-infrared light. This is due to thermal radiation of interstellar dust contained in molecular clouds."[104]
Visually dark infrared sources can be radiative cosmic dust, hydrogen gas such as an H II region (e.g. the Orion Nebula), an H I region of hydrogen, a molecular cloud, or a coronal cloud.
There are about 1,892,100 infrared (IR) objects in the SIMBAD database. Some of these like IRAS 20542+3631 are only IR objects. 1RXS J205444.6+361116 is an IR and an X-ray object only. These objects are visibly dark infrared sources. As is 2MASS J21074764+3802561, which is an IR and UV object only.
Submillimeters
"Submillimetre astronomy or submillimeter astronomy ... is the branch of observational astronomy that is conducted at submillimetre wavelengths of the electromagnetic spectrum. Astronomers place the submillimetre waveband between the far-infrared and microwave wavebands, typically taken to be between a few hundred micrometres and a millimetre." and "Using submillimetre observations, astronomers examine molecular clouds and dark cloud cores with a goal of clarifying the process of star formation from earliest collapse to stellar birth."[105]
These wavelengths are sometimes called Terahertz radiation, since they have frequencies of the order of 1 THz.
“The Balloon-borne Large Aperture Submillimeter Telescope (BLAST) is a submillimeter telescope that hangs from a high altitude balloon. It has a 2 meter primary mirror that directs light into bolometer arrays operating at 250, 350, and 500 µm. ... BLAST's primary science goals are:[106]
- Measure photometric redshifts, rest-frame [Far infrared] FIR luminosities and star formation rates of high-redshift starburst galaxies, thereby constraining the evolutionary history of those galaxies that produce the FIR/submillimeter background.
- Measure cold pre-stellar sources associated with the earliest stages of star and planet formation.
- Make high-resolution maps of diffuse galactic emission over a wide range of galactic latitudes.”[107]
Microwaves
"Microwaves, a subset of radio waves, have wavelengths ranging from as long as one meter to as short as one millimeter, or equivalently, with frequencies between 300 MHz (0.3 GHz) and 300 GHz.[108] This broad definition includes both UHF and [Extremely high frequency] EHF (millimeter waves), and various sources use different boundaries.[109] In all cases, microwave includes the entire [super high frequency] SHF band (3 to 30 GHz, or 10 to 1 cm) at minimum, with RF engineering often putting the lower boundary at 1 GHz (30 cm), and the upper around 100 GHz (3 mm)."[110]
Radars
"The advantages of radar in planetary astronomy result from (1) the observer's control of all the attributes of the coherent signal used to illuminate the target, especially the wave form's time/frequency modulation and polarization; (2) the ability of radar to resolve objects spatially via measurements of the distribution of echo power in time delay and Doppler frequency; (3) the pronounced degree to which delay-Doppler measurements constrain orbits and spin vectors; and (4) centimeter-to-meter wavelengths, which easily penetrate optically opaque planetary clouds and cometary comae, permit investigation of near-surface macrostructure and bulk density, and are sensitive to high concentrations of metal or, in certain situations, ice."[111]
Radios
"Radio waves are a type of electromagnetic radiation with wavelengths in the electromagnetic spectrum longer than infrared light. Radio waves have frequencies from 300 [Gigahertz] GHz to as low as 3 [kilohertz] kHz, and corresponding wavelengths from 1 millimeter to 100 kilometers."[112]
Several satellites have served as observatories for radio waves and specifically for microwaves. The Radio Astronomy Explorer (RAE) 1 is launched into orbit on July 4, 1968, around Earth, while the [Explorer 49] RAE 2 is launched on June 10, 1973, around the Moon.
The COBE is launched into Earth orbit on November 18, 1989. The WMAP is launched on June 30, 2001, into orbit at the [Lissajous orbit] Lagrange 2 location. Both satellites have aboard detectors designed to perform microwave astronomy, as these are limited to only the microwave band.
Superluminals
In the diagram at right, the black line is the shock wave of Cherenkov radiation, shown only in one moment of time. This double image effect is most prominent for an observer located directly in the path of a superluminal object (in this example a sphere, shown in grey). The right hand bluish shape is the image formed by the blue-doppler shifted light arriving at the observer—who is located at the apex of the black Cherenkov lines—from the sphere as it approaches. The left-hand reddish image is formed from red-shifted light that leaves the sphere after it passes the observer. Because the object arrives before the light, the observer sees nothing until the sphere starts to pass the observer, after which the image-as-seen-by-the-observer splits into two—one of the arriving sphere (to the right) and one of the departing sphere (to the left).
Superluminal refers "to the propagation of information or matter faster than the speed of light. Under the special theory of relativity, a particle (that has [mass in special relativity] rest mass) with subluminal velocity needs infinite energy to accelerate to the speed of light, although special relativity does not forbid the existence of particles that travel faster than light at all times (tachyons)."[113]
"On the other hand, what some physicists refer to as "apparent" or "effective" FTL[114][115][116][117] depends on the hypothesis that unusually distorted regions of spacetime might permit matter to reach distant locations in less time than light could in normal or undistorted spacetime. Although according to current theories matter is still required to travel subluminally with respect to the locally distorted spacetime region, apparent FTL is not excluded by general relativity."[113]
Tachyonic γ rays have not been observed directly as of 2007.[118] "The tachyonic spectral densities generated by ultra-relativistic electrons in uniform motion are fitted to the high-energy spectra of Galactic supernova remnants, such as RX J0852.0−4622 and the pulsar wind nebulae in G0.9+0.1 and MSH 15-52. ... Tachyonic cascade spectra are quite capable of generating the spectral curvature seen ... Estimates on the electron/proton populations generating the tachyon flux are obtained from the spectral fits"[118]
"Tachyonic radiation implies superluminal signal transfer [1-7], the energy quanta propagating faster than light in vacuum, in contrast to rotating superluminal light sources emitting vacuum Cherenkov radiation [8, 9]."[119] "The existence of superluminal energy transfer has not been established so far, and one may ask why. There is the possibility that superluminal quanta just do not exist, the vacuum speed of light being the definitive upper bound. There is another explanation, the interaction of superluminal radiation with matter is very small, the quotient of tachyonic and electric fine-structure constants being q2/e2 ≈ 1.4 x 10⁻¹¹ [5], and therefore superluminal quanta are hard to detect."[119]
“Observed variations concerning the brightness distributions in four extragalactic radio sources were so rapid that the apparent transverse velocity of expansion is greater than the velocity of light.”[120]
Plasma objects
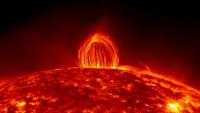
"[A] medium-strength flare erupted from the sun on July 19, 2012. The blast also generated the enormous, shimmering plasma loops, which are an example of a phenomenon known as "coronal rain," agency officials said."[121]
"Hot plasma in the corona cooled and condensed along strong magnetic fields in the region" slowly falling back to the solar surface as plasma "rain".[121]
Gaseous objects
"In the sparse upper atmosphere of Mars, about 120 (75 miles) kilometers above its surface, the observed X-rays [shown in the image at right] are produced by fluorescent radiation from oxygen atoms."[122]
"X-radiation from the Sun impacts oxygen atoms, knock electrons out of the inner parts of their electron clouds, and excite the atoms to a higher energy level in the process. The atoms almost immediately return to their lower energy state and may emit a fluorescent X-ray in this process with an energy characteristic of the atom involved - oxygen in this case. A similar process involving ultraviolet light produces the visible light from fluorescent lamps."[122]
"The X-ray power detected from the Martian atmosphere is very small, amounting to only 4 megawatts, comparable to the X-ray power of about ten thousand medical X-ray machines. Chandra was scheduled to observe Mars when it was only 70 million kilometers from Earth, and also near the point in its orbit when it is closest to the Sun."[122]
"At the time of the Chandra observation, a huge dust storm developed on Mars that covered about one hemisphere, later to cover the entire planet. This hemisphere rotated out of view over the course of the 9-hour observation but no change was observed in the X-ray intensity, implying that the dust storm did not affect the upper atmosphere."[122]
"The astronomers also found evidence for a faint halo of X-rays that extends out to 7,000 kilometers above the surface of Mars. Scientists believe the X-rays are produced by collisions of ions racing away from the Sun (the solar wind) with oxygen and hydrogen atoms in the tenuous exosphere of Mars."[122]
Liquid objects
Def. "precipitation products of the condensation of atmospheric water vapour"[123] are called hydrometeors.
"Condensation or sublimation of atmospheric water vapor produces a hydrometeor. It forms in the free atmosphere, or at the earth's surface, and includes frozen water lifted by the wind. Hydrometeors which can cause a surface visibility reduction, generally fall into one of the following two categories:
- Precipitation. Precipitation includes all forms of water particles, both liquid and solid, which fall from the atmosphere and reach the ground; these include: liquid precipitation (drizzle and rain), freezing precipitation (freezing drizzle and freezing rain), and solid (frozen) precipitation (ice pellets, hail, snow, snow pellets, snow grains, and ice crystals).
- Suspended (Liquid or Solid) Water Particles. Liquid or solid water particles that form and remain suspended in the air (damp haze, cloud, fog, ice fog, and mist), as well as liquid or solid water particles that are lifted by the wind from the earth’s surface (drifting snow, blowing snow, blowing spray) cause restrictions to visibility. One of the more unusual causes of reduced visibility due to suspended water/ice particles is whiteout, while the most common cause is fog."[124]
Rocky objects

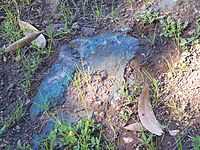
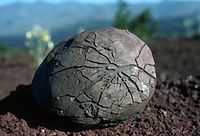
"Sin-Kamen (Синь-Камень, in Russian literally – Blue Stone, or Blue Rock) is a type of pagan sacred stones, widespread in Russia, in areas historically inhabited by both Eastern Slavic (Russian), and Uralic tribes (Merya, Muroma[125])."[126]
"While in the majority of cases, the stones belonging to the Blue Stones type, have a black, or dark gray color, this particular stone [in the image] does indeed look dark blue, when wet.[127]"[126]
"Several types of rock surface materials can be recognized at the two sites [Viking Lander 1 and Viking Lander 2]; dark, relatively 'blue' rock surfaces are probably minimally weathered igneous rock, whereas bright rock surfaces, with a green/(blue + red) ratio higher than that of any other surface material, are interpreted as a weathering product formed in situ on the rock."[128]
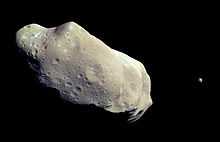
At second right is an approximately natural color image of the asteroid 243 Ida. "There are brighter areas, appearing bluish in the picture, around craters on the upper left end of Ida, around the small bright crater near the center of the asteroid, and near the upper right-hand edge (the limb). This is a combination of more reflected blue light and greater absorption of near infrared light, suggesting a difference in the abundance or composition of iron-bearing minerals in these areas."[129]
"The [Sloan Digital Sky Survey] SDSS “blue” asteroids are related to the C-type (carbonaceous) asteroids, but not all of them are C-type. They are a mixture of C-, E-, M-, and P-types."[130]
Chemistry
“[T]he study of the abundance and reactions of chemical elements and molecules in the universe, [as can be assessed by] their interaction with radiation” is part of astronomical radiation chemistry".[131]
Each of the different forms of radiation often interact with chemicals in novel and sometimes surprising ways.
"Ultraviolet line spectrum measurements are used to discern the chemical composition, densities, and temperatures of the interstellar medium, and the temperature and composition of hot young stars."[57]
Hydrogens
The Balmer series of emission lines from hydrogen occur in the visible spectrum of the Sun at: 397, 410, 434, 486, and 656 nm. Hα is the red line at the far right.
Heliums
Helium "was first detected as an unknown yellow spectral line signature in sunlight during a solar eclipse in 1868 by French astronomer Jules Janssen. Janssen is jointly credited with detecting the element along with Norman Lockyer during the solar eclipse of 1868, and Lockyer was the first to propose that the line was due to a new element, which he named."[132]
Lithiums

"Violet satellite bands are caused by those lithium atoms which undergo an optical transition while a helium atom is nearby."[133]
Lithium I has an orange line at 610.3 nm. In some 824 red giant stars, the Li I 670.78 nm line was detected in several stars, "but only the five objects ... presented a strong line. Indeed, the Li subordinate line at 6103.6 Å was detected in these stars only."[134]
Berylliums
"High-resolution, high signal-to-noise ratio spectra, obtained at the Cerro Tololo Inter-American Observatory 4 m telescope, of the Be II 3131 Å [313.1 nm] region [are from] the metal-rich solar analog α Centauri A and its companion α Centauri B."[135]
"The photospheric abundances of the light elements Li, Be, and B provide important clues about stellar structure and evolution, as they are destroyed by (p,α)-reactions at temperatures exceeding a few million degrees."[135]
"For Cen A, ... [Be/H] = +0.20 ± 0.15, where the error reflects random uncertainties at the 1σ confidence level; systematic errors of 0.1 dex are also possible."[135]
Borons
Boron is detected in the Population II star HD 140283 by observing the "wavelength region around the resonance lines of B I at 2497 Å ... with the Goddard High Resolution Spectrograph (GHRS) of the Hubble Space Telescope on September 5, 1992, ... and continued on February 15, and 21, 1993"[136] "The resulting B/Be ratio is in the range 9-34 with 17 being the most probable value. This is in very good agreement with predictions for cosmic ray spallation."[136]
Carbons
Nitrogens
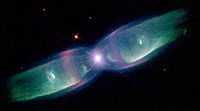
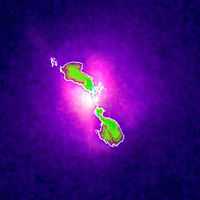
"M2-9 [in the image at right] is a striking example of a "butterfly" or a bipolar planetary nebula. Another more revealing name might be the "Twin Jet Nebula." If the nebula is sliced across the star, each side of it appears much like a pair of exhausts from jet engines. Indeed, because of the nebula's shape and the measured velocity of the gas, in excess of 200 miles per second, astronomers believe that the description as a super-super-sonic jet exhaust is quite apt. Ground-based studies have shown that the nebula's size increases with time, suggesting that the stellar outburst that formed the lobes occurred just 1,200 years ago."[137]
Oxygens
"Electron temperatures are generally derived from the ratio of auroral to nebular lines in [O III] or [N II]."[138] "[B]ecause of the proximity of strong night-sky lines at λ4358 and λλ5770, 5791, the auroral lines of [O III] λ4363 and [N II] λ5755 are often contaminated."[138]
Fluorines
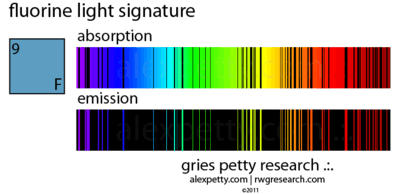
"Fluorine abundances for red giants of type K, Ba, M, MS, S, SC,N, and J [may be] obtained from the [infrared] rotation-vibration lines of the molecule HF. There appears to be a clear correlation between [F/O] and 12C/16O since N stars display F abundances up to 30 times the solar system value. This correlation points toward the He-burning shell as the site of F synthesis. The nuclear chain 14N(α,γ)18F(β+)18O(p,α)15N(α,γ)19F (where protons come from 13C(α,n)16O followed by 14N(n,p)14C) operating at the very beginning of He-burning is the most likely for 19F production in thermal pulses."[139]
Neons
Ions
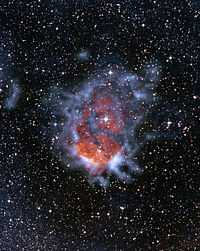
The image at right is a colour "composite image of RCW120. It reveals how an expanding bubble of ionised gas about ten light-years across is causing the surrounding material to collapse into dense clumps where new stars are then formed. The 870-micron submillimetre-wavelength data were taken with the LABOCA camera on the 12-m Atacama Pathfinder Experiment (APEX) telescope. Here, the submillimetre emission is shown as the blue clouds surrounding the reddish glow of the ionised gas (shown with data from the SuperCosmos H-alpha survey). The image also contains data from the Second Generation Digitized Sky Survey (I-band shown in blue, R-band shown in red)."[140]
Compounds
Usually, "Hibonite ((Ca,Ce)(Al,Ti,Mg)12O19) [as shown at right] is a brownish black mineral ... It is rare, but is found in high-grade metamorphic rocks on Madagascar. Some presolar grains in primitive meteorites consist of hibonite. Hibonite also is a common mineral in the Ca-Al-rich inclusions (CAIs) found in some [chondrite] chondritic meteorites. Hibonite is closely related to hibonite-Fe (IMA 2009-027, ((Fe,Mg)Al12O19)) an alteration mineral from the Allende meteorite.[141] [Hibonite] is blue [perhaps like the image at left] in meteorite occurrence."[142]
Alloys
"Grain size varies from 98 to 530 lm with an average of *150 lm. Minor [elements] oxidation [from an iron–nickel–chromium–cobalt–phosphorus alloy] is evidenced by the presence of a light brown and blue surface layer composed of very fine-grained (<1 lm) crystals on the surface."[143] "[T]he oxidation of minor elements in metallic alloys in the early solar system" is indicated to possess at instances a blue surface layer.[143]
Atmospheres
"If we know beforehand that a nebula is not of the emission type, observations of its polarization enable us to go a step farther. In general, if a particle scatters light in such a way that it does not hold the energy for any length of time but simply defects it without change of wave-length, then the polarization of the deflected light has the following characteristics: (a) its plane of polarization is usually perpendicular to or, more rarely, parallel to the plane formed by the incident and the scattered rays; and (b) the amount of polarization is inversely correlated with the size of the particles. When the scattering particles are of the order of size of a few hundred molecules or smaller we have what is usually known as Rayleigh scattering. Here the polarization reaches very large values, as is evidenced by our own blue atmosphere, which gives values up to 70 per cent."[144]
Materials
"The depth of the absorption bands and the continuum reflectance of [Kuiper Belt Object] 1996 TO66 suggest the presence of a black- to slightly blue-colored, spectrally featureless particulate material as a minority component mixed with the water ice."[145]
Meteorites
Def. "[a] metallic or stony object that is the remains of a meteor"[146] is called a meteorite.
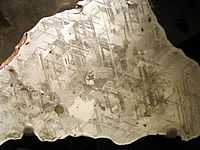
"Widmanstätten patterns, also called Thomson structures, are unique figures of long nickel-iron crystals, found in the octahedrite iron meteorites and some pallasite]]s. They consist of a fine interleaving of kamacite and taenite bands or ribbons called lamellæ. Commonly, in gaps between the lamellæ, a fine-grained mixture of kamacite and taenite called plessite can be found."[147]
Shelters
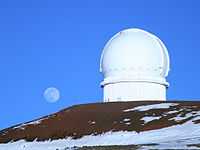
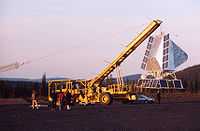
"The Canada-France-Hawaii Telescope (CFHT) is a 3.6 m optical-infrared telescope located on the summit of Mauna Kea on the island of Hawaii."[148]
The Canada-France-Hawaii Telescope (CFHT) is "at an altitude of 4,204 meters [...] Mauna Kea last erupted 4,000 to 6,000 years ago [~7,000 b2k]. [...] The Mauna Kea Observatories are used for scientific research across the electromagnetic spectrum from visible light to radio, and comprise the largest such facility in the world."[149]
Spectroscopy
"Astronomical spectroscopy is the technique of spectroscopy used in astronomy. The object of study is the spectrum of electromagnetic radiation, including visible light, which radiates from stars and other celestial objects. Spectroscopy can be used to derive many properties of distant stars and galaxies, such as their chemical composition, but also their motion by Doppler shift measurements."[150]
Spectrometers
Def. a "visual representation of the spectrum of a celestial body's radiation"[151] is called a spectrogram.
Def. a "machine for recording spectra, producing spectrograms"[152] is called a spectrograph.
Def. an "optical instrument for measuring the absorption of light by chemical substances; typically it will plot a graph of absorption versus wavelength or frequency, and the patterns produced are used to identify the substances present, and their internal structure"[153] is called a spectrometer.
Def. the "measurement of the wavelength of electromagnetic radiation, especially any of several techniques used to analyze the structure of molecules; the measurement of spectra of things other than radiation, such as the masses of molecules and their breakdown products"[154] is called spectrometry.
Def. the "scientific study of spectra" often using spectrometers[155] is called spectroscopy.
Planetary astronomy
"Energetic photons, ions and electrons from the solar wind, together with galactic and extragalactic cosmic rays, constantly bombard surfaces of planets, planetary satellites, dust particles, comets and asteroids."[156] "[I]nterplanetary space ... is a stormy and sometimes very violent environment permeated by energetic particles and radiation constantly emanating from the Sun."[156]
Each of the astronomical objects that constitute planetary science emits, reflects, or fluoresces radiation that is observed and analyzed.
"The spectrum of gaseous methane at 77 K in the 1.1-2.6 µm region [is] a benchmark for planetary astronomy".[157]
Sun
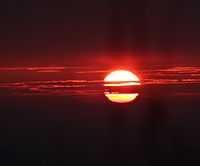
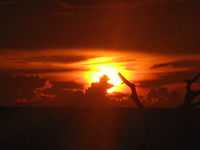
But truly, the now famous sun set at the peak where you will witness the panorama of rolling green hills and also a glimpse of Arabian sea and the bright orange sun going down the hills might force one to contemplate on the nature and its complex beauty. And to witness the same sun rise above the foggy and misty hills and over a blanket of silver clouds the next early morning would be the perfect way to start a day.
Geography
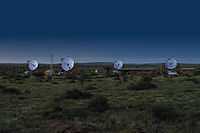
"High Energy Stereoscopic System or H.E.S.S. is a next-generation system of Imaging Atmospheric Cherenkov Telescopes (IACT) for the investigation of cosmic gamma rays in the 100 GeV and TeV energy range. The acronym was chosen in honour of Victor Hess, who was the first to observe cosmic rays."[158]
"The name also emphasizes two main features of the currently-operating installation, namely the simultaneous observation of air showers with several telescopes, under different viewing angles, and the combination of telescopes to a large system to increase the effective detection area for gamma rays. H.E.S.S. permits the exploration of gamma-ray sources with intensities at a level of a few thousandth parts of the flux of the Crab Nebula."[158]
"H.E.S.S. is located on the Cranz family farm, Göllschau, in Namibia, near the Gamsberg, an area well known for its excellent optical quality. The first of the four telescopes of Phase I of the H.E.S.S. project went into operation in Summer 2002; all four were operational in December 2003."[158]
"The ideal submillimetre observing site is dry, cool, has stable weather conditions and is away from urban population centres. There are only a handful of such sites identified, they include [Mauna Kea Observatory] Mauna Kea (Hawaii, USA), the Llano de Chajnantor Observatory on the Atacama Plateau (Chile), the South Pole, and Hanla (India). Comparisons show that all four sites are excellent for submillimetre astronomy, and of these sites Mauna Kea is the most established and arguably the most accessible. The Llano de Chajnantor Observatory site hosts the Atacama Pathfinder Experiment (APEX), the largest submillimetre telescope operating in the southern hemisphere, and the world's largest ground based astronomy project, the Atacama Large Millimeter Array (ALMA), an interferometer for submillimetre wavelength observations made of 54 12-metre and 12 7-metre radio telescopes. The Submillimeter Array (SMA) is another interferometer, located at Mauna Kea, consisting of eight 6-metre diameter radio telescopes. The largest existing submillimetre telescope, the James Clerk Maxwell Telescope, is also located on Mauna Kea."[105]
Recent history
The recent history period dates from around 1,000 b2k to present.
The Hominidae have apparently been on Earth for around seven million years, at least somewhere in Africa and possibly elsewhere. Fortunately and deliberately, many of these have worked out ways to record knowledge about the objects or entities in the sky observed by the radiation they produce.
"Mere "star ordering" is not "astronomy", so far as the modern usage of the term implies, regardless of the word's etymology".[145]
The modern scientific discipline of astronomy focuses on reproducibility and physical theory to explain and describe observations. Many ancient observers produced remarkably reproducible calendars such as the Mesoamerican Long Count calendar which apparently goes from August 11, 3114 [Common era] BCE [5114 b2k], to October 13, 4772 [2772 a2k], and beyond.
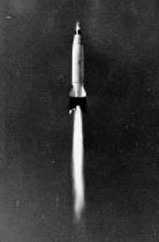
From X-ray astronomy: "The beginning of the search for X-ray sources above the Earth's atmosphere is August 5, 1948, at 12:07 GMT (Greenwich Mean Time).[159][160] As part of Project Hermes a US Army (formerly German) V-2 rocket number 43 is launched from White Sands Proving Grounds, launch complex (LC) 33, to an altitude of 166 km.[160] This is "the first detection of solar X-rays."[161]"
"Infrared astronomy began in the 1830s, a few decades after the discovery of infrared light by William Herschel in 1800."[103]
"The initial detection of radio waves from an astronomical object was made in the 1930s, when Karl Jansky observed radiation coming from the Milky Way."[162]
Mathematics
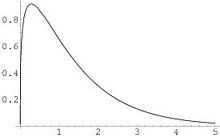
"In astrophysics, x is usually a ratio of frequencies, that is, the frequency over a critical frequency (critical frequency is the frequency at which most synchrotron radiation is radiated). This is needed when calculating the spectra for different types of synchrotron emission. It takes a spectrum of electrons (or any charged particle) generated by a separate process (such as a power law distribution of electrons and positrons from a constant injection spectrum) and converts this to the spectrum of photons generated by the input electrons/positrons.”[163]
Mathematics is involved in many ways to help describe the entities or objects used to model radiation astronomy results.
Usually, in mathematical astronomy, a number is associated with a dimension or aspect of an entity. For example, the Earth is 1.50 x 10⁸ km on average from the Sun. Kilometer (km) is a dimension and 1.50 x 10⁸ is a number.
Def. the "study of the dimensions of ... quantities; used to obtain information about large complex systems, and as a means of checking ... equations"[164] is called dimensional analysis.
Physics
The physics of radiation astronomy consists of the emission of radiation by a source and the detection of this radiation by devices available to the astronomer. Astrophysics at its simplest is the application of laboratory physics, i.e., physics demonstrated in a laboratory and described with logical laws, to natural astronomical entities. This is done to understand these astronomical entities, their origin, history, and current constitution.
The electron volt (eV) is a unit that will be useful later.
The eV is the energy gained by an electron in passing through a potential difference of one volt. Since the charge on an electron is 1.60218 x 10⁻¹⁹ Coulombs, an eV is 1.60218 x 10⁻¹⁹ J. A keV is 1000 eV and a MeV is 1000 keV).
A photon with an energy of 1eV has a frequency of 1 eV/h = 2.41799 x 10¹⁴ Hz or about 242 THz and a wavelength of c.h/1 eV = 1.23984 x 10⁻⁶ m or about 1,240 nm or 12,400 Å. That would put the photon in the infrared range. In practice, photon energies are seldom stated for such long wavelengths.
Sciences
"An astronomical X-ray source catalog or catalogue is a list or tabulation of astronomical objects that are X-ray sources, typically grouped together because they share a common type, morphology, origin, means of detection, or method of discovery. Astronomical X-ray source catalogs are usually the result of an astronomical survey of some kind, often performed using an X-ray astronomical observatory in orbit around Earth."[165]
- "Distribution and Variability of Cosmic X-Ray Sources", published on April 1, 1967, describes 35 astronomical X-ray sources detected by sounding rocket launched with an X-ray detector on board by the X-ray astronomy group at the Naval Research Laboratory in the United States.[166]
- "The fourth Uhuru catalog of X-ray sources", contains 339 sources observed over the entire active period of the satellite, but not necessarily the earlier designation.[167] It does not contain actual dates of observation for any sources. Sources detected during the final observation period from August 27, 1973, to January 12, 1974, are prefixed with "4U".
- "The Ariel V /3 A/ catalogue of X-ray sources. II - Sources at high galactic latitude |b| > 10°", contains sources with high galactic latitudes and includes some sources observed by HEAO 1, Einstein, OSO 7, SAS 3, Uhuru, and earlier, mainly rocket, observations.[168]
Technology
“In an X-ray tube, electrons are accelerated in a vacuum by an electric field and shot into a piece of metal called the "target". X-rays are emitted as the electrons slow down (decelerate) in the metal. The output spectrum consists of a continuous spectrum of X-rays, with additional sharp peaks at certain energies (see graph on right). The continuous spectrum is due to bremsstrahlung, while the sharp peaks are characteristic X-rays associated with the atoms in the target. For this reason, bremsstrahlung in this context is also called continuous X-rays.[169]”[170]
“A synchrotron is a particular type of cyclic particle accelerator originating from the cyclotron in which the guiding magnetic field (bending the particles into a closed path) is time-dependent, being synchronized to a particle beam of increasing kinetic energy. The synchrotron is one of the first accelerator concepts that enable the construction of large-scale facilities, since bending, beam focusing and acceleration can be separated into different components. ... Unlike in a cyclotron, synchrotrons are unable to accelerate particles from zero kinetic energy; one of the obvious reasons for this is that its closed particle path would be cut by a device that emits particles. Thus, schemes were developed to inject pre-accelerated particle beams into a synchrotron. The pre-acceleration can be realized by a chain of other accelerator structures like a linac, a microtron or another synchrotron; all of these in turn need to be fed by a particle source comprising a simple high voltage power supply, typically a Cockcroft-Walton generator.”[163]
Research
Hypothesis:
- Almost every naturally occurring subatomic particle may be used in astronomy to provide information on astronomical entities, sources, or objects.
Proof of concept
Def. a “short and/or incomplete realization of a certain method or idea to demonstrate its feasibility"[171] is called a proof of concept.
Def. evidence that demonstrates that a concept is possible is called proof of concept.
The proof-of-concept structure consists of
- background,
- procedures,
- findings, and
- interpretation.[172]
Control groups

The findings demonstrate a statistically systematic change from the status quo or the control group.
“In the design of experiments, treatments [or special properties or characteristics] are applied to [or observed in] experimental units in the treatment group(s).[173] In comparative experiments, members of the complementary group, the control group, receive either no treatment or a standard treatment.[174]"[175]
See also
- Big bang
- Chemistry glossary
- Dominant group/Astronomy
- Dominant group/Physics
- Dominant group/Planetary science
- Electromagnetic radiation
- Infrared Spectroscopy
- Lofting technology
- Principles of Radiation Astronomy
- Radioactivity
- Radioactivity basics
- Stellar evolution
- The Big Bang Theory
- Theoretical astronomy
- Theoretical radiation astronomy
References
- 1 2 3 4 5 Philip B. Gove, ed (1963). Webster's Seventh New Collegiate Dictionary. Springfield, Massachusetts: G. & C. Merriam Company. pp. 1221.
- ↑ "Radiation, In: Wikipedia". San Francisco, California: Wikimedia Foundation, Inc. May 31, 2012. Retrieved 2012-06-02.
- ↑ Długosz (4 May 2004). "radiation, In: Wiktionary". San Francisco, California: Wikimedia Foundation, Inc. Retrieved 2015-03-28.
- ↑ "Radiation protection, In: Wikipedia". San Francisco, California: Wikimedia Foundation, Inc. May 8, 2012. Retrieved 2012-06-02.
- 1 2 Stuart Ross Taylor (29 July 2004). "Why can't planets be like stars?". Nature 430 (6999): 509. doi:10.1038/430509a. PMID 15282586. http://www.nature.com/nature/journal/v430/n6999/full/430509a.html.
- ↑ "Planetary science, In: Wikipedia". San Francisco, California: Wikimedia Foundation, Inc. May 16, 2012. Retrieved 2012-06-06.
- ↑ "Autunite, In: Wikipedia". San Francisco, California: Wikimedia Foundation, Inc. February 21, 2013. Retrieved 2013-05-06.
- ↑ "Uraninite, In: Wikipedia". San Francisco, California: Wikimedia Foundation, Inc. April 20, 2013. Retrieved 2013-05-08.
- 1 2 3 Narlikar JV (1990). Pasachoff JM, Percy JR. ed. Curriculum for the Training of Astronomers ‘’In: The Teaching of astronomy. Cambridge, England: Cambridge University Press. http://adsabs.harvard.edu/abs/1990teas.conf....7N.
- ↑ Guido Alpa (1994). "General Principles of Law". Annual Survey of International & Comparative Law 1: 1. http://heinonlinebackup.com/hol-cgi-bin/get_pdf.cgi?handle=hein.journals/ansurintcl1§ion=4. Retrieved 2012-04-29.
- ↑ "Principle, In: Wikipedia". San Francisco, California: Wikimedia Foundation, Inc. May 13, 2012. Retrieved 2012-06-07.
- ↑ A. Finoguenov, M.G. Watson, M. Tanaka, C.Simpson, M. Cirasuolo, J.S. Dunlop, J.A. Peacock, D. Farrah, M. Akiyama, Y. Ueda, V. Smolčič, G. Stewart, S. Rawlings, C.vanBreukelen, O. Almaini, L.Clewley, D.G. Bonfield, M.J. Jarvis, J.M. Barr, S. Foucaud, R.J. McLure, K. Sekiguchi, E. Egami (April 2010). "X-ray groups and clusters of galaxies in the Subaru-XMM Deep Field". Monthly Notices of the Royal Astronomical Society 403 (4): 2063-76. doi:10.1111/j.1365-2966.2010.16256.x. http://onlinelibrary.wiley.com/doi/10.1111/j.1365-2966.2010.16256.x/full. Retrieved 2011-12-09.
- ↑ "crater, In: Wiktionary". San Francisco, California: Wikimedia Foundation, Inc. October 16, 2012. Retrieved 2013-02-15.
- ↑ "Enki Catena, In: Wikipedia". San Francisco, California: Wikimedia Foundation, Inc. December 8, 2012. Retrieved 2013-02-16.
- ↑ Tanmay Vachaspati (1998). "Topological defects in the cosmos and lab". Contemporary Physics 39 (4): 225-37. doi:10.1080/001075198181928. http://www.tandfonline.com/doi/abs/10.1080/001075198181928. Retrieved 2013-11-05.
- 1 2 3 J. Singleton, A. Ardavan, H. Ardavan, J. Fopma and D. Halliday (2005). Non-spherically-decaying radiation from an oscillating superluminal polarization current: possible low-power, deep-space communication applications in the MHz and THz bands, 16th International Symposium on Space Terahertz Technology. pp. 117. http://www.nrao.edu/meetings/isstt/papers/2005/2005117000.pdf. Retrieved 2014-03-18.
- ↑ Bill Keel (October 2003). "Jets, Superluminal Motion, and Gamma-Ray Bursts". Tucson, Arizona USA: University of Arizona. Retrieved 2014-03-19.
- ↑ Lawrence M. Krauss, Scott Tremaine (January 1988). "Test of the Weak Equivalence Principle for Neutrinos and Photons". Physical Review Letters 60 (3): 176–7. doi:10.1103/PhysRevLett.60.176. http://link.aps.org/doi/10.1103/PhysRevLett.60.176.
- ↑ "Lyc photon, In: Wikipedia". San Francisco, California: Wikimedia Foundation, Inc. May 6, 2009. Retrieved 2013-07-02.
- ↑ Adolf N. Witt, Karl D. Gordon and Douglas G. Furton (July 1, 1998). "Silicon Nanoparticles: Source of Extended Red Emission?". The Astrophysical Journal Letters 501 (1): L111-5. doi:10.1086/311453. http://iopscience.iop.org/1538-4357/501/1/L111. Retrieved 2013-07-30.
- ↑ Nicole P. Vogt and Martha P. Haynes, Riccardo Giovanelli, and Terry Herter (June 2004). "M/L, Hα Rotation Curves, and HI Gas Measurements for 329 Nearby Cluster and Field Spirals. III. Evolution in Fundamental Galaxy Parameters". The Astronomical Journal 127 (6): 3325-37. doi:10.1086/420703. http://iopscience.iop.org/1538-3881/127/6/3325. Retrieved 2013-12-20.
- ↑ "Ultraviolet, In: Wikipedia". San Francisco, California: Wikimedia Foundation, Inc. June 26, 2012. Retrieved 2012-06-26.
- ↑ "Extragalactic background light, In: Wikipedia". San Francisco, California: Wikimedia Foundation, Inc. March 15, 2013. Retrieved 2013-05-03.
- ↑ "Meteoroid, In: Wikipedia". San Francisco, California: Wikimedia Foundation, Inc. July 1, 2012. Retrieved 2012-07-01.
- 1 2 "meteor, In: Wiktionary". San Francisco, California: Wikimedia Foundation, Inc. October 5, 2012. Retrieved 2012-10-13.
- 1 2 S. Swordy (2001). "The energy spectra and anisotropies of cosmic rays". Space Science Reviews 99: 85–94.
- ↑ The Pierre Auger Collaboration (November 2007). "Correlation of the Highest-Energy Cosmic Rays with Nearby Extragalactic Objects". Science 318 (5852): 938-43. doi:10.1126/science.1151124. http://www.sciencemag.org/content/318/5852/938.full. Retrieved 2011-11-24.
- ↑ Open Questions in Physics. German Electron-Synchrotron. A Research Centre of the Helmholtz Association. Updated March 2006 by JCB. Original by John Baez.
- 1 2 "Ultra-high-energy cosmic ray, In: Wikipedia". San Francisco, California: Wikimedia Foundation, Inc. June 6, 2012. Retrieved 2012-06-07.
- ↑ J. Walker (January 4, 1994). "The Oh-My-God Particle". Fourmilab.
- 1 2 3 4 5 6 7 DAILY MAIL REPORTER (August 12, 2011). "Giant Necklace Nebula brightly glows with dense knots of blue, green and red gases". United Kingdom: Daily Mail. Retrieved 2014-02-24.
- ↑ E. L. Chupp, H. Debrunner, E. Flueckiger, D. J. Forrest, F. Golliez, G. Kanbach, W. T. Vestrand, J. Cooper, G. Share (July 15, 1987). "Solar neutron emissivity during the large flare on 1982 June 3". The Astrophysical Journal 318 (7): 913-25. doi:10.1086/165423. http://adsabs.harvard.edu/abs/1987ApJ...318..913C. Retrieved 2014-04-08.
- 1 2 3 Fargion D, Khlopov M, Konoplich R, De Sanctis Lucentini PG, De Santis M, Mele B (March 2003). "Ultra High Energy Particle Astronomy, Neutrino Masses and Tau Airshowers". Recent Research and Development in Astrophysics 1 (3): 395-454. http://arxiv.org/pdf/astro-ph/0303233.
- ↑ Lingenfelter RE, Flamm EJ, Canfield EH, Kellman S (September 1965). "High-Energy Solar Neutrons 2. Flux at the Earth". Journal of Geophysical Research 70 (17): 4087–95. doi:10.1029/JZ070i017p04087.
- 1 2 3 David R. Williams (November 2011). "Lunar Prospector Neutron Spectrometer (NS)". Goddard Space Flight Laboratory: National Aeronautics and Space Administration. Retrieved 2012-01-11.
- 1 2 Francis Halzen and Dan Hooper (July 2002). "High-energy neutrino astronomy: the cosmic ray connection". Reports on Progress in Physics 65 (7): 1025-78. doi:10.1088/0034-4885/65/7/201. http://arxiv.org/pdf/astro-ph/0204527. Retrieved 2011-11-24.
- ↑ K. D. Hoffman (May 12, 2009). "High energy neutrino telescopes". New Journal of Physics 11 (5): 055006. doi:10.1088/1367-2630/11/5/055006. http://arxiv.org/pdf/astro-ph/0204527. Retrieved 2012-03-28.
- ↑ Charles H. Jackman, Richard D. McPeters, Gordon J. Labow, Eric L.Fleming, Cid J. Praderas, James M. Russell (August 2001). "Northern Hemisphere atmospheric effects due to the July 2000 solar proton event". Geophysical Research Letters 28 (15): 2883-6. http://cdaw.gsfc.nasa.gov/meetings/2009_gle/data/Jackman/Jackman_2001.pdf. Retrieved 2011-11-24.
- ↑ "Beta particle, In: Wikipedia". San Francisco, California: Wikimedia Foundation, Inc. May 28, 2012. Retrieved 2012-06-08.
- ↑ K. R. Schultz (September 1998). "Cost Effective Steps to Fusion power: IFE target fabrication, injection and tracking". Journal of Fusion Energy 17 (3): 237-46. doi:10.1023/A:1021814514091. http://www.springerlink.com/content/r7u527p786144l7k/. Retrieved 2012-06-08.
- ↑ L. A. Rancitelli, R. W. Perkins, W. D. Felix, and N. A. Wogman (1971). "Erosion and mixing of the lunar surface from cosmogenic and primordial radio-nuclide measurements in Apollo 12 lunar samples". Proceedings of the Lunar Science Conference 2: 1757-72. http://adsabs.harvard.edu/full/1971LPSC....2.1757R. Retrieved 2012-06-08.
- ↑ S. Wolpert (July 24, 2008). "Scientists solve 30-year-old aurora borealis mystery". University of California. Retrieved 2008-10-11.
- 1 2 3 4 5 H. S. Hudson and A. B. Galvin (September 1997). A. Wilson. ed. Correlated Studies at Activity Maximum: the Sun and the Solar Wind, In: Correlated Phenomena at the Sun, in the Heliosphere and in Geospace. Noordwijk, The Netherlands: European Space Agency. pp. 275-82. ISBN 92-9092-660-0.
- ↑ "Delta ray, In: Wikipedia". San Francisco, California: Wikimedia Foundation, Inc. July 26, 2012. Retrieved 2012-09-17.
- 1 2 T. H. Burnett et al.; The JACEE Collaboration (January 1990). "Energy spectra of cosmic rays above 1 TeV per nucleon". The Astrophysical Journal 349 (1): L25-8. doi:10.1086/185642. http://adsabs.harvard.edu/cgi-bin/nph-data_query?bibcode=1990ApJ...349L..25B&link_type=GIF&db_key=AST. Retrieved 2011-11-25.
- ↑ P.A.Milne, J.D.Kurfess, R.L.Kinzer, M.D.Leising, D.D.Dixon (April 2000). Investigations of positron annihilation radiation, In: Proceedings of the 5th COMPTON Symposium. 510. Washington, DC: American Institute of Physics. pp. 21-30. doi:10.1063/1.1303167. http://arxiv.org/abs/astro-ph/9911184. Retrieved 2011-11-25.
- 1 2 G. Weidenspointner, G.K. Skinner, P. Jean, J. Knödlseder, P. von Ballmoos, R. Diehl, A. Strong, B. Cordier, S. Schanne, C. Winkler (October 2008). "Positron astronomy with SPI/INTEGRAL". New Astronomy Reviews 52 (7-10): 454-6. doi:10.1016/j.newar.2008.06.019. http://www.sciencedirect.com/science/article/pii/S1387647308001164. Retrieved 2011-11-25.
- ↑ "Muon, In: Wikipedia". San Francisco, California: Wikimedia Foundation, Inc. January 15, 2013. Retrieved 2013-01-18.
- 1 2 "Neutrino detector, In: Wikipedia". San Francisco, California: Wikimedia Foundation, Inc. May 23, 2012. Retrieved 2012-06-08.
- ↑ "Neutrino astronomy, In: Wikipedia". San Francisco, California: Wikimedia Foundation, Inc. March 5, 2012. Retrieved 2012-06-08.
- ↑ KENNETH CHANG (April 26, 2005). "Tiny, Plentiful and Really Hard to Catch". The New York Times. Retrieved 2011-06-16. "In 1987, astronomers counted 19 neutrinos from an explosion of a star in the nearby Large Magellanic Cloud, 19 out of the billion trillion trillion trillion trillion neutrinos that flew from the supernova."
- ↑ "Gamma-ray astronomy, In: Wikipedia". San Francisco, California: Wikimedia Foundation, Inc. May 15, 2012. Retrieved 2012-09-17.
- ↑ "Vela (satellite), In: Wikipedia". San Francisco, California: Wikimedia Foundation, Inc. June 27, 2012. Retrieved 2012-09-17.
- ↑ Vedrenne, G and Atteia, J.-L. (2009). Gamma-Ray Bursts: The brightest explosions in the Universe. Springer/Praxis Books. ISBN 978-3-540-39085-5. http://books.google.com/?id=jZHSdrvzz0gC&printsec=frontcover#v=onepage&q&f=false.
- ↑ "Gamma-ray burst, In: Wikipedia". San Francisco, California: Wikimedia Foundation, Inc. September 3, 2012. Retrieved 2012-09-17.
- 1 2 "Ultraviolet astronomy, In: Wikipedia". San Francisco, California: Wikimedia Foundation, Inc. June 2, 2012. Retrieved 2012-06-06.
- ↑ Chung Chieh (December 1997). "Hydrogen Spectra". Waterloo, Ontario, Canada: University of Waterloo. Retrieved 2012-06-06.
- ↑ Eric Hilbert (May 28, 2012). "Deep-Sky Wonders". State College, Pennsylvania: Starlight Astronomy Club. Retrieved 2012-06-06.
- 1 2 "Optical astronomy, In: Wikipedia". San Francisco, California: Wikimedia Foundation, Inc. June 29, 2009. Retrieved 2012-06-08.
- ↑ "optical astronomy, In: Wiktionary". San Francisco, California: Wikimedia Foundation, Inc. December 6, 2009. Retrieved 2012-09-17.
- ↑ "adaptive optics, In: Wiktionary". San Francisco, California: Wikimedia Foundation, Inc. 17 September 2012. Retrieved 2012-09-17.
- ↑ François Roddier, ed (1999). Adaptive Optics in Astronomy. Cambridge, United Kingdom: Cambridge University Press. pp. 411. ISBN 0 521 55375 X. http://catdir.loc.gov/catdir/samples/cam031/00500597.pdf. Retrieved 2012-02-15.
- ↑ David F. Gray (1992), The Inferred Color Index of the Sun, Publications of the Astronomical Society of the Pacific, vol. 104, no. 681, pp. 1035-1038 (November 1992)
- ↑ The Simbad Astronomical Database' Rigel page
- ↑ "Color index, In: Wikipedia". San Francisco, California: Wikimedia Foundation, Inc. June 20, 2012. Retrieved 2012-06-26.
- ↑ Barrie William Jones. The search for life continued: planets around other stars. p. 111. http://books.google.com/books?id=5wX9aHqfBS0C&pg=PA111&lr=&cd=55#v=onepage&f=false.
- ↑ "Telescope, In: Wikipedia". San Francisco, California: Wikimedia Foundation, Inc. September 14, 2012. Retrieved 2012-09-17.
- ↑ Antony Cooke (2005). Visual Astronomy Under Dark Skies: A New Approach to Observing Deep Space. London: Springer-Verlag. pp. 180. ISBN 1852339012. http://books.google.com/books?id=SXmrBfl4H3sC&dq=entity+astronomy&lr=&source=gbs_navlinks_s. Retrieved 2011-11-06.
- ↑ Cecie Starr (2005). Biology: Concepts and Applications. Thomson Brooks/Cole. ISBN 053446226X. http://books.google.com/?id=RtSpGV_Pl_0C&pg=PA94.
- ↑ "Visible spectrum, In: Wikipedia". San Francisco, California: Wikimedia Foundation, Inc. September 15, 2012. Retrieved 2012-09-17.
- 1 2 3 T. Sivarani, P. Bonifacio, P. Molaro, R. Cayrel, M. Spite, F. Spite, B. Plez, J. Andersen, B. Barbuy, T. C. Beers, E. Depagne, V. Hill, P. François, B. Nordström, and F. Primas (January 2004). "First stars IV. CS 29497-030: Evidence for operation of the s-process at very low metallicity". Astronomy and Astrophysics 413 (1): 1073-85. doi:10.1051/0004-6361:20031590. http://arxiv.org/pdf/astro-ph/0310291.pdf. Retrieved 2012-06-02.
- ↑ Jesse D. Bregman and Joel N. Bregman (May 15, 1978). "The violet opacity of carbon stars". The Astrophysical Journal 222 (5): L41-3. doi:10.1086/182688.
- ↑ W. H. Wright (August 1927). "Photographs of Venus made by Infra-red and by Violet Light". Publications of the Astronomical Society of the Pacific 39 (230): 220-1. doi:10.1086/123718.
- ↑ Nathan Smith, Jon A. Morse, Nicholas R. Collins, and Theodore R. Gull (August 2004). "The Purple Haze of η Carinae: Binary-induced Variability?". The Astrophysical Journal 610 (2): L105-8. doi:10.1086/423341.
- 1 2 Preston, G. W.; Beers, T. C.; Shectman, S. A. (December 1993). "The Space Density and Kinematics of Metal-Poor Blue Main Sequence Stars Near the Solar Circle". Bulletin of the American Astronomical Society 25 (12): 1415.
- 1 2 Klochkova, Valentina; Ermakov, Sergey; Panchuk, Vladimir; Zhao, Gang (July 2007). Ana I. Gómez de Castro and Martin A. Barstow. ed. High resolution spectroscopy of halo stars within the spectral region 3550-5000 °A°A, In: UV Astronomy: Stars from Birth to Death. Proceedings of the Joint Discussion n.4 during the IAU general Assembly of 2006. International Astronomical Union. pp. 161. ISBN 978-84-7491-852-6. Bibcode: 2007uasb.conf..161K.
- ↑ Juna A. Kollmeier and Andrew Gould (July 20, 2007). "Where Are the Old-Population Hypervelocity Stars?". The Astrophysical Journal 664 (1): 343-8. doi:10.1086/518405. http://iopscience.iop.org/0004-637X/664/1/343. Retrieved 2012-03-05.
- ↑ Crisp, D.; Hammel, H. B. (June 14, 1995). "Hubble Space Telescope Observations of Neptune". Hubble News Center. Retrieved April 22, 2007.
- ↑ Munsell, Kirk; Smith, Harman; Harvey, Samantha (November 13, 2007). "Neptune overview". Solar System Exploration. NASA. Retrieved February 20, 2008.
- ↑ "Neptune, In: Wikipedia". San Francisco, California: Wikimedia Foundation, Inc. June 1, 2012. Retrieved 2012-06-08.
- ↑ Jonathan I. Lunine (1993). "The Atmospheres of Uranus and Neptune". Annual Review of Astronomy and Astrophysics 31: 217–263. doi:10.1146/annurev.aa.31.090193.001245.
- ↑ "Uranus, In: Wikipedia". San Francisco, California: Wikimedia Foundation, Inc. June 5, 2012. Retrieved 2012-06-08.
- 1 2 Wolfhard Schlosser, Rita Schulz, Paul Koczet (1986). The cyan shells of Comet P/Halley, In: Proceedings of the 20th ESLAB Symposium on the Exploration of Halley's Comet. 3. European Space Agency. pp. 495-8. Bibcode: 1986ESASP.250c.495S.
- 1 2 James A. Phillips (2009). "Green Comet Approaches Earth". National Aeronautics and Space Administration Science News. Retrieved 2012-05-05.
- ↑ "Electric blue (color), In: Wikipedia". San Francisco, California: Wikimedia Foundation, Inc. May 4, 2012. Retrieved 2012-06-08.
- 1 2 3 4 I. Bertini, N. Thomas, and C. Barbieri (January 2007). "Modeling of the light scattering properties of cometary dust using fractal aggregates". Astronomy & Astrophysics 461 (1): 351-64. doi:10.1051/0004-6361:20065461. http://www.aanda.org/articles/aa/full/2007/01/aa5461-06/aa5461-06.html. Retrieved 2011-12-08.
- ↑ "The building blocks of planets within the `terrestrial' region of protoplanetary disks". nottingham.ac.uk. Retrieved 2008-03-04.
- ↑ "Stardust (spacecraft), In: Wikipedia". San Francisco, California: Wikimedia Foundation, Inc. August 28, 2012. Retrieved 2012-09-17.
- 1 2 3 Harold Zirin (March 1959). "Physical Conditions in Limb Flares and Active Prominences. II. a Remarkable Limb Flare, December 18, 1956". Astrophysical Journal 129 (3): 414-23. doi:10.1086/146633.
- ↑ Rosaly MC Lopes (2006). "Io: The Volcanic Moon". In Lucy-Ann McFadden, Paul R. Weissman, Torrence V. Johnson. Encyclopedia of the Solar System. Academic Press. pp. 419–431. ISBN 978-0-12-088589-3.
- ↑ Lopes, R. M. C.; et al. (2004). "Lava lakes on Io: Observations of Io’s volcanic activity from Galileo NIMS during the 2001 fly-bys". Icarus 169 (1): 140–174. doi:10.1016/j.icarus.2003.11.013.
- ↑ "Io (moon), In: Wikipedia". San Francisco, California: Wikimedia Foundation, Inc. June 7, 2012. Retrieved 2012-06-08.
- ↑ Faber Birren (Summer 1983). "Color and human response". Color Research and Application 8 (2): 75-81. doi:10.1002/col.5080080204. http://onlinelibrary.wiley.com/doi/10.1002/col.5080080204/abstract. Retrieved 2012-04-23.
- ↑ Elkins-Tanton, Linda T. (2006). Jupiter and Saturn. New York: Chelsea House. ISBN 0-8160-5196-8.
- ↑ Strycker, P. D.; Chanover, N.; Sussman, M.; Simon-Miller, A. (2006). A Spectroscopic Search for Jupiter's Chromophores. American Astronomical Society. Bibcode: 2006DPS....38.1115S.
- ↑ Gierasch, Peter J.; Nicholson, Philip D. (2004). "Jupiter". World Book @ NASA. Retrieved 2006-08-10.
- ↑ "Jupiter, In: Wikipedia". San Francisco, California: Wikimedia Foundation, Inc. June 7, 2012. Retrieved 2012-06-08.
- ↑ G. H. Herbig (March 1974). "VY Canis Majoris. IV. The emission bands of ScO". The Astrophysical Journal 188 (3): 533-8. doi:10.1086/152744.
- ↑ J. E. Littleton and Sumner P. Davis (October 1988). "Transition strength data for the orange and red bands of CaCl". The Astrophysical Journal 333 (10): 1026-34. doi:10.1086/166809.
- ↑ F. P. Keenan and P. H. Norrington (July 1987). "Relative emission line strengths for Fe VII in astrophysical plasmas". Astronomy and Astrophysics 181 (2): 370-2.
- ↑ M. Pim FitzGerald (February 1970). "The Intrinsic Colours of Stars and Two-Colour Reddening Lines". Astronomy and Astrophysics 4 (2): 234-43.
- 1 2 3 "Infrared astronomy, In: Wikipedia". San Francisco, California: Wikimedia Foundation, Inc. May 10, 2012. Retrieved 2012-06-08.
- 1 2 "Far-infrared astronomy, In: Wikipedia". San Francisco, California: Wikimedia Foundation, Inc. May 24, 2012. Retrieved 2012-09-17.
- 1 2 "Submillimetre astronomy, In: Wikipedia". San Francisco, California: Wikimedia Foundation, Inc. June 2, 2012. Retrieved 2012-06-08.
- ↑ BLAST Public Webpage
- ↑ "BLAST (telescope), In: Wikipedia". San Francisco, California: Wikimedia Foundation, Inc. February 4, 2012. Retrieved 2012-06-08.
- ↑ Pozar, David M. (1993). Microwave Engineering Addison-Wesley Publishing Company. ISBN 0-201-50418-9.
- ↑ http://www.google.com/search?hl=en&defl=en&q=define:microwave&ei=e6CMSsWUI5OHmQee2si1DQ&sa=X&oi=glossary_definition&ct=title
- ↑ "Microwave, In: Wikipedia". San Francisco, California: Wikimedia Foundation, Inc. September 10, 2012. Retrieved 2012-09-17.
- ↑ Steven J. Ostro (October-December 1993). "Planetary radar astronomy". Reviews of Modern Physics 65 (4): 1235-79. doi:10.1103/RevModPhys.65.1235. http://rmp.aps.org/abstract/RMP/v65/i4/p1235_1. Retrieved 2012-02-09.
- ↑ "Radio waves, In: Wikipedia". San Francisco, California: Wikimedia Foundation, Inc. September 14, 2012. Retrieved 2012-09-17.
- 1 2 "Faster-than-light, In:Wikipedia". San Francisco, California: Wikimedia Foundation, Inc. May 29, 2012. Retrieved 2012-06-08.
- ↑ Gonzalez-Diaz, P. F. (2000). "Warp drive space-time". Physical Review D 62 (4): 044005. doi:10.1103/PhysRevD.62.044005. http://omnis.if.ufrj.br/~mbr/warp/etc/PRD62_44005.pdf.
- ↑ F. Loup, David Waite, E. Halerewicz Jr. (2001). [ttp://arxiv.org/abs/gr-qc/0107097 "Reduced Total Energy Requirements for a Modified Alcubierre Warp Drive Spacetime"]. arXiv:gr-qc/0107097. Bibcode:2001gr.qc.....7097L.
- ↑ Visser, M.; Bassett, B.; Liberati, S. (2000). "Superluminal censorship". Nuclear Physics B: Proceedings Supplement 88: 267–270. doi:10.1016/S0920-5632(00)00782-9.
- ↑ Visser, M.; Bassett, B.; Liberati, S. (1999). "Perturbative superluminal censorship and the null energy condition". AIP Conference Proceedings 493: 301–305. doi:10.1063/1.1301601. ISBN 1-56396-905-X.
- 1 2 Roman Tomaschitz (March 2007). "Superluminal cascade spectra of TeV [gamma-ray sources"]. Annals of Physics 322 (3): 677-700. doi:10.1016/j.aop.2006.11.005. http://wallpaintings.at/geminga/superluminal_cascade_spectra_TeV_gamma-ray_sources.pdf. Retrieved 2011-11-24.
- 1 2 R Tomaschitz (October 2010). "Superluminal spectral densities of ultra-relativistic electrons in intense electromagnetic wave fields". Applied Physics B Lasers and Optics 101 (1-2): 143-64. doi:10.1007/s00340-010-4182-8. http://wallpaintings.at/geminga/superluminal_spectral_densities_ultra-relativistic_electrons_electromagnetic_wave_fields.pdf. Retrieved 2012-03-21.
- ↑ M. H. Cohen, K. I. Kellermann, D. B. Shaffer, R. P. Linfield, A. T. Moffet, J. D. Romney, G. A. Seielstad, I. I. K. Pauliny-Toth, E. Preuss, A. Witzel, R. T. Schilizzi & B. J. Geldzahler (August 1977). "Radio sources with superluminal velocities". Nature 268: 405-9. doi:10.1038/268405a0.
- 1 2 Mike Wall (February 21, 2013). "Super-Hot Plasma 'Rain' Falls on Sun in Amazing Video". Yahoo! News. Retrieved 2013-02-23.
- 1 2 3 4 5 K. Dennerl et al. (November 7, 2002). "Mars: Mars Glows in X-rays". Boston, Massachusetts, USA: NASA, Harvard University. Retrieved 2012-11-26.
- ↑ "hydrometeor, In: Wiktionary". San Francisco, California: Wikimedia Foundation, Inc. July 7, 2012. Retrieved 2013-02-15.
- ↑ Mark R. Mireles, Kirth L. Pederson, Charles H. Elford (February 21, 2007). Meteorologial Techniques. 106 Peacekeeper Drive, Suite 2N3, Offutt Air Force Base, Nebraska USA: Air Force Weather Agency/DNT. http://oai.dtic.mil/oai/oai?verb=getRecord&metadataPrefix=html&identifier=ADA466107. Retrieved 2013-02-17.
- ↑ И.Д. Маланин. Материалы разведки Синих камней Подмосковья в 2003 году // Краеведение и регионоведение. Межвузовский сборник научных трудов. ч.1. Владимир, 2004. (Russian)
- 1 2 "Blue Stone (Russia), In: Wikipedia". San Francisco, California: Wikimedia Foundation, Inc. March 20, 2013. Retrieved 2013-05-31.
- ↑ Бердников, В. Синий камень Плещеева озера // Наука и жизнь. – 1985. – № 1. – С. 134–139. (Russian)
- ↑ Edwin L. Strickland III (March 19-23 1979). Martian soil stratigraphy and rock coatings observed in color-enhanced Viking Lander images, In: Lunar and Planetary Science Conference Proceedings. 3. New York: Pergamon Press, Inc.. pp. 3055-77. http://adsabs.harvard.edu/abs/1979LPSC...10.3055S. Retrieved 2013-05-31.
- ↑ Sue Lavoie (January 29, 1996). "PIA00069: Ida and Dactyl in Enhanced Color". Pasadena, California USA: NASA/JPL. Retrieved 2013-06-01.
- ↑ F Yoshida, T Nakamura (June 2007). "Subaru main belt asteroid survey (SMBAS)—size and color distributions of small main-belt asteroids". Planetary and Space Science 55 (9): 1113-25. doi:10.1016/j.pss.2006.11.016. http://www.sciencedirect.com/science/article/pii/S0032063306003357. Retrieved 2013-06-01.
- ↑ "Astrochemistry, In: Wikipedia". San Francisco, California: Wikimedia Foundation, Inc. April 6, 2012. Retrieved 2012-06-08.
- ↑ "Helium, In: Wikipedia". San Francisco, California: Wikimedia Foundation, Inc. June 7, 2012. Retrieved 2012-06-09.
- ↑ G. D. Mahan (April 24, 1972). "Violet satellite bands in the spectra of Li perturbed by He". Physics Letters A 39 (2): 145-6. doi:10.1016/0375-9601(72)91056-0. http://www.sciencedirect.com/science/article/pii/0375960172910560. Retrieved 2013-03-23.
- ↑ L. Monaco, S. Villanova, C. Moni Bidin, G. Carraro, D. Geisler, P. Bonifacio, O. A. Gonzalez, M. Zoccali and L. Jilkova (May 2011). "Lithium-rich giants in the Galactic thick disk". Astronomy & Astrophysics 529 (5): 10. doi:10.1051/0004-6361/201016285.
- 1 2 3 Jeremy R. King, Constantine P. Deliyannis, and Merchant Boesgaard (April 1, 1997). "The 9Be Abundances of α Centauri A and B and the Sun: Implications for Stellar Evolution and Mixing". The Astrophysical Journal 478 (2): 778. http://iopscience.iop.org/0004-637X/478/2/778/pdf/0004-637X_478_2_778.pdf. Retrieved 2012-07-11.
- 1 2 Bengt Edvardsson, B. Gustafsson, S.G. Johansson, D. Kiselman, D.L. Lambert, P.E. Nissen, and G. Gilmore (October 1994). "Boron in the extreme Population II star HD 140283 and the production of light elements in the Early Galaxy". Astronomy and Astrophysics 290 (10): 176-82.
- ↑ Bruce Balick (December 17, 1997). "Supersonic Exhaust from Nebula M2-9". Baltimore, Maryland USA: Hubble Site. Retrieved 2014-02-26.
- 1 2 S. A. Hawley (September 1, 1978). "The chemical composition of galactic and extragalactic H II regions". The Astrophysical Journal 224 (9): 417-36. doi:10.1086/156389.
- ↑ A. Jorissen, V.V. Smith, and D.L. Lambert (July 1992). "Fluorine in red giant stars: evidence for nucleosynthesis". Astronomy and Astrophysics 261 (1): 164-87. http://adsabs.harvard.edu/abs/1992A&A...261..164J. Retrieved 2013-08-01.
- ↑ Deharveng (November 11, 2008). "Glowing Stellar Nurseries". European Southern Observatory. Retrieved 2014-03-13.
- ↑ IMA Mineral List with Database of Mineral Properties
- ↑ "Hibonite, In: Wikipedia". San Francisco, California: Wikimedia Foundation, Inc. March 7, 2013. Retrieved 2013-06-01.
- 1 2 Dante S. Lauretta, Britney E. Schmidt (April 1, 2009). "Oxidation of Minor Elements from an Iron–Nickel–Chromium–Cobalt–Phosphorus Alloy in 17.3% CO2–H2 gas mixtures at 700–1000 °C". Oxidation of Metals 71 (3-4): 219-35. doi:10.1007/s11085-009-9140-7. http://link.springer.com/article/10.1007/s11085-009-9140-7. Retrieved 2013-06-01.
- ↑ L. G. Henyey (December 1936). "On the Polarization of Light in Reflection Nebulae". The Astrophysical Journal 84 (12): 609-18. doi:10.1086/143787. http://adsabs.harvard.edu/abs/1936ApJ....84..609H. Retrieved 2013-06-01.
- 1 2 Robert H. Brown, Dale P. Cruikshank, and Yvonne Pendleton (July 1, 1999). "Water Ice on Kuiper Belt Object 1996 TO66". The Astrophysical Journal 519 (1): L101-4. doi:10.1086/312098. http://iopscience.iop.org/1538-4357/519/1/L101/fulltext/. Retrieved 2013-06-01.
- ↑ "meteorite, In: Wiktionary". San Francisco, California: Wikimedia Foundation, Inc. 14 February 2015. Retrieved 2015-03-28.
- ↑ "Widmanstätten pattern, In: Wikipedia". San Francisco, California: Wikimedia Foundation, Inc. May 9, 2012. Retrieved 2012-06-08.
- ↑ Paul Murdin (November 2000). Paul Murdin. ed. Canada-France-Hawaii Telescope, In: Encyclopedia of Astronomy and Astrophysics. Bristol: Institute of Physics. doi:10.1888/0333750888/4166. Bibcode: 2000eaa..bookE4166..
- ↑ "Canada-France-Hawaii Telescope, In: Wikipedia". San Francisco, California: Wikimedia Foundation, Inc. October 6, 2012. Retrieved 2012-12-09.
- ↑ "Astronomical spectroscopy, In: Wikipedia". San Francisco, California: Wikimedia Foundation, Inc. December 8, 2012. Retrieved 2013-01-09.
- ↑ "spectrogram, In: Wiktionary". San Francisco, California: Wikimedia Foundation, Inc. June 19, 2013. Retrieved 2014-03-24.
- ↑ "spectrograph, In: Wiktionary". San Francisco, California: Wikimedia Foundation, Inc. October 8, 2013. Retrieved 2014-03-24.
- ↑ "spectrometer, In: Wiktionary". San Francisco, California: Wikimedia Foundation, Inc. May 23, 2014. Retrieved 2014-06-04.
- ↑ "spectrometry, In: Wiktionary". San Francisco, California: Wikimedia Foundation, Inc. October 8, 2013. Retrieved 2014-06-04.
- ↑ "spectroscopy, In: Wiktionary". San Francisco, California: Wikimedia Foundation, Inc. May 23, 2014. Retrieved 2014-06-04.
- 1 2 Theodore E. Madey, Robert E. Johnson, Thom M. Orlando (March 2002). "Far-out surface science: radiation-induced surface processes in the solar system". Surface Science 500 (1-3): 838-58. doi:10.1016/S0039-6028(01)01556-4. http://www.physics.rutgers.edu/~madey/Publications/Full_Publications/PDF/madey_SS_2002.pdf. Retrieved 2012-02-09.
- ↑ A. R. W. McKellar (November 1989). "The spectrum of gaseous methane at 77 K in the 1.1-2.6 μm region: a benchmark for planetary astronomy". Canadian Journal of Physics 67 (11): 1027-35. doi:10.1139/p89-180. http://www.nrcresearchpress.com/doi/abs/10.1139/p89-180. Retrieved 2012-02-09.
- 1 2 3 "High Energy Stereoscopic System, In: Wikipedia". San Francisco, California: Wikimedia Foundation, Inc. August 1, 2012. Retrieved 2012-09-17.
- ↑ Rolf Mewe (December 1996). "X-ray Spectroscopy of Stellar Coronae: History - Present - Future". Solar Physics 169 (2): 335-48. doi:10.1007/BF00190610.
- 1 2 T. R. Burnight (1949). "Soft X-radiation in the upper atmosphere". Physical Review A 76: 165.
- ↑ Pounds (1962). "A simple rocket-borne X-radiation monitor-its scope and results of an early flight". Monthly Notices of the Royal Astronomical Society 123: 347-57. http://adsabs.harvard.edu/full/1962MNRAS.123..347P. Retrieved 2011-10-16.
- ↑ "Radio astronomy, In: Wikipedia". San Francisco, California: Wikimedia Foundation, Inc. June 3, 2012. Retrieved 2012-06-08.
- 1 2 "Synchrotron function, In: Wikipedia". San Francisco, California: Wikimedia Foundation, Inc. December 5, 2011. Retrieved 2012-05-14.
- ↑ "dimensional analysis, In: Wiktionary". San Francisco, California: Wikimedia Foundation, Inc. November 10, 2012. Retrieved 2013-01-31.
- ↑ Marshallsumter (May 31, 2014). "X-ray astronomy, In: Wikiversity". San Francisco, California: Wikimedia Foundation, Inc. Retrieved 2014-06-04.
- ↑ Friedman H, Byram ET, Chubb TA (April 1967). "Distribution and Variability of Cosmic X-Ray Sources". Science 156 (3773): 374-8. doi:10.1126/science.156.3773.374. PMID 17812381.
- ↑ Forman W, Jones C, Cominsky L, Julien P, Murray S, Peters G (December 1978). "The fourth Uhuru catalog of X-ray sources". The Astrophysical Journal Supplemental Series 38 (12): 357-412. doi:0.1086/190561.
- ↑ McHardy IM, Lawrence A, Pye JP, Pounds KA (December 1981). "The Ariel V /3 A/ catalogue of X-ray sources. II - Sources at high galactic latitude /absolute value of B greater than 10 deg/". Monthly Notices of the Royal Astronomical Society (MNRAS) 197: 893-919.
- ↑ Electron microprobe analysis and scanning electron microscopy in geology, by S. J. B. Reed, 2005, page 12
- ↑ "Bremsstrahlung, In: Wikipedia". San Francisco, California: Wikimedia Foundation, Inc. August 26, 2012. Retrieved 2012-09-17.
- ↑ "proof of concept, In: Wiktionary". San Francisco, California: Wikimedia Foundation, Inc. November 10, 2012. Retrieved 2013-01-13.
- ↑ Ginger Lehrman and Ian B Hogue, Sarah Palmer, Cheryl Jennings, Celsa A Spina, Ann Wiegand, Alan L Landay, Robert W Coombs, Douglas D Richman, John W Mellors, John M Coffin, Ronald J Bosch, David M Margolis (August 13, 2005). "Depletion of latent HIV-1 infection in vivo: a proof-of-concept study". Lancet 366 (9485): 549-55. doi:10.1016/S0140-6736(05)67098-5. http://www.sciencedirect.com/science/article/pii/S0140673605670985. Retrieved 2012-05-09.
- ↑ Klaus Hinkelmann, Oscar Kempthorne (2008). Design and Analysis of Experiments, Volume I: Introduction to Experimental Design (2nd ed.). Wiley. ISBN 978-0-471-72756-9. http://books.google.com/?id=T3wWj2kVYZgC&printsec=frontcover.
- ↑ R. A. Bailey (2008). Design of comparative experiments. Cambridge University Press. ISBN 978-0-521-68357-9. http://www.cambridge.org/uk/catalogue/catalogue.asp?isbn=9780521683579.
- ↑ "Treatment and control groups, In: Wikipedia". San Francisco, California: Wikimedia Foundation, Inc. May 18, 2012. Retrieved 2012-05-31.
Further reading
- Eberhard Haug & Werner Nakel (2004). The elementary process of Bremsstrahlung. River Edge NJ: World Scientific. p. Scientific lecture notes in physics, vol. 73. ISBN 9812385789. http://books.google.com/books?hl=en&id=v4FMtIwTri8C&dq=bremsstrahlung+haug&printsec=frontcover&source=web&ots=THjay1eeFA&sig=aHe-xMFwT8jxhpAGJHDnxKC6Jjc#PPA29,M1.
- Vedrenne, G and Atteia, J.-L. (2009). Gamma-Ray Bursts: The brightest explosions in the Universe. Springer. ISBN 978-3540390855. http://books.google.com/books?id=jZHSdrvzz0gC&printsec=frontcover&source=gbs_v2_summary_r&cad=0#v=onepage&q&f=false.
External links
- African Journals Online
- Bing Advanced search
- Google Books
- Google scholar Advanced Scholar Search
- International Astronomical Union
- Is My Favorite Object an X-ray, Gamma-Ray, or EUV Source?
- JSTOR
- Lycos search
- NASA/IPAC Extragalactic Database - NED
- NASA's National Space Science Data Center
- Questia - The Online Library of Books and Journals
- SAGE journals online
- The SAO/NASA Astrophysics Data System
- Scirus for scientific information only advanced search
- SDSS Quick Look tool: SkyServer
- SIMBAD Astronomical Database
- Spacecraft Query at NASA.
- Taylor & Francis Online
- Universal coordinate converter
- Wiley Online Library Advanced Search
- Yahoo Advanced Web Search
| |||||||||||||||||||||||||||||
![]() This is a research project at http://en.wikiversity.org
This is a research project at http://en.wikiversity.org
| |
Resource type: this resource is an article. |
| |
Resource type: this resource contains a lecture or lecture notes. |
| |
Subject classification: this is an astronomy resource. |