Physics and Astronomy Labs/Beads on string drop
< Physics and Astronomy Labs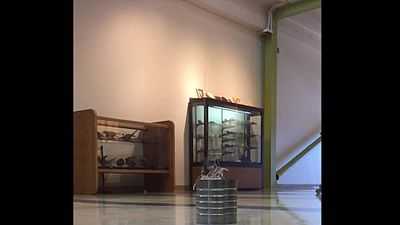
The introduction is under construction
Student tasks yet to be done:
- Astronomy students will be tasked with describing the procedure used to take data, and attempting to explain how a connection to Galileo justifies this as an "astronomy experiment".
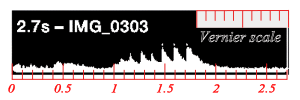
- Somebody needs to link the data taken from the cell phone video to Wikiversity's Vernier scale where this data is analyzed.
- The audiovideo file shows the string falling in real time and in slow motion. We need to verify that the time-scale on the screenshot is accurate because preliminary estimates indicate that there is a 15% error in either the paperclip positions or the time measured between strikes. This might be related to a well-known slinky-drop video. See Hooke's law and Young's modulus for efforts to measure the stiffness of the string, which in turn can be used to calculate the propagation time of a compressional wave that propagates downward when the string is released. This would cause a delay in the time for the early paperclips to drop, giving the illusion of stronger gravity than is the case.
- Mechanical engineering students will be tasked with writing a calculation that explains why the distance of the n-th paperclip from the bottom of the string should vary as n-squared. They will also show how to use how a plot of n versus time can be used to calculate g.
Measuring earth's gravitational field, g
http://www.physicsclassroom.com/class/1DKin/Lesson-6/Kinematic-Equations
Entry level Wikipedia article on Earth's gravitational acceleration.
Wikipedia article on the Vernier scale.
Wikiversity resource using Vernier scale to measure impact times
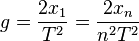
Use the cell phone audio data to find g using,
 ,
,
where T is the time between two consecutive hits by the paperclips, x1 is the initial distance of the first paperclip above the coffee can, and we hope to obtain a value for the acceleration of gravity at Earth's surface approximately equal to g ≈ 9.8 m/s2.
Exercise: Prove the two equations shown above. (click for hint)
- Use
- Begin with the first paperclip at x1 and explain why vi equals zero.
- Explain why the time for the n-th paperclip to fall is nT.
- Write down the formula that relates xn to x1 and n.
- The rest is algebra
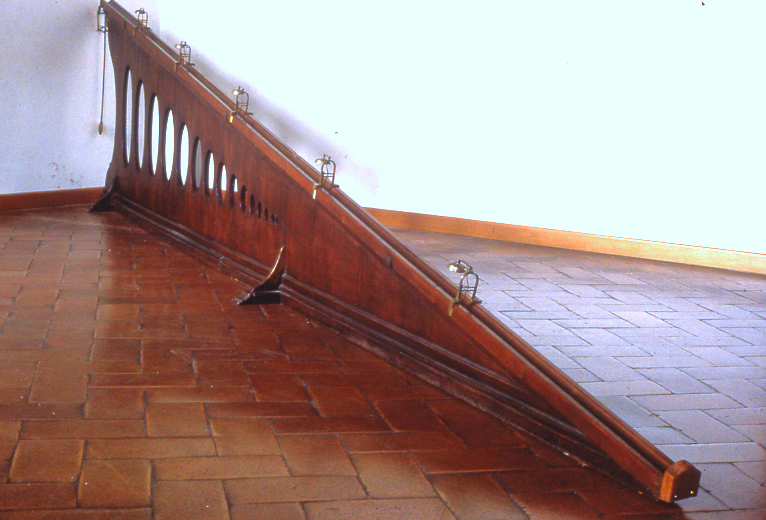
Future project: Make a model Galileo's ramp
Astronomy students learn how Galileo, Kepler and Newton (and others) developed a theory for how planets revolve around the Sun. Of these people, Galileo did the kinds of experiments best suited for labs in a college science course. Unfortunately this image is not available on commons. But at least two Wikipedia pages that could use such an image:
I asked commons about the legality of making and then photographing a 3D model of the device, either out cardboard or using Solidworks software. They seemed to think it was OK to post an such an image on commons.
Recent data to be processed
Engineers measured intervals on 2/5/15
They used the peak, not the leading edge. The class took median values and by consensus concluded the average spaceing was consistent with
 and
and 
Data on string and paperclips
- Each paperclip except one weighed 1.065 g. One weighed 1.466 g. The string was 5.04 m long and had a mass of 2.578 g.
Where did we situate those paperclips?
Gaussian parametric versus a nonparametric methods: An introduction to hypothesis testing
There was some confusion about the distance to the first paperclip. A preliminary investigation suggested that 3 inches was a suitable gap, but we constructed the device using meter sticks. Three inches is about 7.6 cm. Did we round the first gap to 8 cm, or did we use 7.6 cm? The drop seems to have moved the paperclips when we remeasured the lengths on the next day. Since the answer was either 7.6 or 8, it was time for some hypothesis testing.
- Hypothesis A was that the first gap was constructed at 7.6cm and hypothesis B was that it was 8cm. All other paperclip positions were calculated (in cm) as either 7.6n2 or 8n2, where n is an integer. But for a variety of reasons, the paperclips were not at these exact locations the next day. We remeasured all the lengths. Now we pose the question: Is the data more consistent with hypothesis A or hypothesis B?
This led to an interesting discussion about outliers and the sum of squares, often abbreviated as SS. Depending on how the analysis is performed, we got different results. Three methods suggested the correct scenario B and one suggests scenario A as being more likely.[1]
Explanation of columns in the spreadsheet
The spreadsheet that follows shows the measured paperclip locations, as measured one day after the string was dropped and handled in such a way that it is understandable that the paperclips had moved. The spreadsheet also displays the calculated paperclip positions under our two alternative hypotheses (A and B).
Using Excel to conduct an informal hypothesis test
This table from Excel[4] shows the observed values of x, as well as the values associated with two possible scenarios[5]. This was an unusual hypothesis test because we are certain the attempt was made to situate the paperclips at either xA or xB. Here ε represents the deviation (so called "error") and SS is the sum of the squares of the deviations. We have one outlier at n=8, so the test was performed with and without that outlier. The last two rows represent what I believe[6] is a simple nonparametric analysis: The column entry equals 1 if that the hypothesis is favored.
Wikipedia article on how the "error" is usually used in the sciences.
| n | n2 | A cm | B cm | xA cm | xB cm | x cm | εA cm | εB cm | εA2 cm2 | εB2 cm2 | * | A likely | B likely |
| 1 | 1 | 8 | 7.6 | 8 | 7.6 | 8 | 0 | −0.4 | 0 | 0.16 | * | 1 | 0 |
| 2 | 4 | 8 | 7.6 | 32 | 30.4 | 31.25 | 0.75 | −0.85 | 0.5625 | 0.7225 | * | 1 | 0 |
| 3 | 9 | 8 | 7.6 | 72 | 68.4 | 71 | 1 | −2.6 | 1 | 6.76 | * | 1 | 0 |
| 4 | 16 | 8 | 7.6 | 128 | 121.6 | 127 | 1 | −5.4 | 1 | 29.16 | * | 1 | 0 |
| 5 | 25 | 8 | 7.6 | 200 | 190 | 198 | 2 | −8 | 4 | 64 | * | 1 | 0 |
| 6 | 36 | 8 | 7.6 | 288 | 273.6 | 286 | 2 | −12.4 | 4 | 153.76 | * | 1 | 0 |
| 7 | 49 | 8 | 7.6 | 392 | 372.4 | 386 | 6 | −13.6 | 36 | 184.96 | * | 1 | 0 |
| 8 | 64 | 8 | 7.6 | 512 | 486.4 | 487 | 25 | −0.6 | 625 | 0.36 | * | 0 | 1 |
| * | * | * | * | * | * | * | * | * | * | * | * | * | * |
| SS | 1-8 | 671.56 | 439.88 | * | 7 | 1 | |||||||
| SS | 1-7 | 10.56 | 254.56 | * |
Questions for the students
The last two columns represent the starting point of something I think is called nonparametric[7] analysis. Place an A or B in each of the cells in the table shown below, depending on which scenario is favored by that analysis:
| nonparametric[8] | Sum of squares | |
| n= 1 to 7 | ||
| n = 1 to 8 |
Plotting activities
- Make a plot of x versus n that shows both scenarios (A and B) as well as the actual measurements.
- Since x is proportional to n, it is better to plot the square root of x versus n. Make such a plot and show the measured values as well as both scenarios.
Footnotes
- ↑ Several students recalled that scenario B (8cm) had occurred. A student asked if I did the calculation for purely pedagogical purposes. I thought it was 8 cm, but wasn't sure, especially when I measured the largest three distances the total error to be more consistent with 7.6.
- ↑ The student who constructed this spreadsheet had instead used the absolute value of the errors to form this measure. But the absolute value function, f(x) =|x| has a sharp corner at x=0. Applied mathematicians can be prissy about functions that are not smooth.
- ↑ An outlier is a data point that seems more in error than the rest.
- ↑ The Excel spreadsheet was converted to wiktext using http://excel2wiki.net/ It was necessary to change the table's header to suit Wikiversity because the website's converter uses a table template unavailable on Wikiversity.
- ↑ Both hypothesis are that xn=n2x1 where x1 is either 7.6 or 8.
- ↑ I am working to confirm this belief.
- ↑ I think I am using the term nonparametric correctly.
- ↑ I think I am using the term nonparametric correctly.