Oceanography
"Oceanography..., also called oceanology or marine science, ... studies the ocean. It covers a wide range of topics, including marine organisms and ecosystem dynamics; ocean currents, waves, and geophysical fluid dynamics; plate tectonics and the geology of the sea floor; and fluxes of various chemical substances and physical properties within the ocean and across its boundaries."[1]
Temperatures
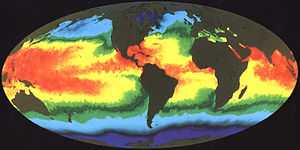
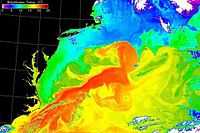
"The above illustration of Earth's sea surface temperature was obtained from two weeks of infrared observations by the Advanced Very High Resolution Radiometer (AVHRR), an instrument on board NOAA-7 during July 1984. Temperatures are color coded with red being warmest and decreasing through oranges, yellows, greens, and blues. Temperature patterns seen in this image are the result of many influences, including the circulation of the ocean, surface winds, and solar heating. The image indicates a large pool of warm water in the Western Pacific and a tongue of relatively cold water extending along the Equator westward from South America. Every few years, there occurs an interrelated set of changes in the global atmospheric and oceanic circulation known as an El Nino in which the region of warm equatorial water in the West extends eastward across the Pacific and blankets the cool, productive regions along the coast of South America. Fish, birds, and marine mammals that depend upon the normally phytoplankton-rich waters often die in large numbers during El Nino. Images of sea surface temperature such as this help scientists to better monitor and ultimately understand the changes to Earth caused by events such as El Nino."[2]
Salinity

"Salinity—the amount of dissolved salt in the water—is critical to so many aspects of the ocean, from circulation to climate to the global water cycle. For much of the past year, NASA and Argentina’s Comisión Nacional de Actividades Espaciales (CONAE) have been making comprehensive observations of sea surface salinity from space. Launched on June 10, 2011, the Aquarius mission is slowly compiling a more complete picture of the salty sea and how it varies."[3]
"The map above shows salinity near the ocean surface as measured by the Aquarius instrument on the Satélite de Aplicaciones Científicas (SAC)-D satellite. The data depicted shows average salinity from May 27 to June 2, 2012, in a range from 30 to 40 grams per kilogram, with 35 grams being the average. Lower values are represented in purples and blues; higher values are shown in shades of orange and red. Black areas occur where no data was available, either due to the orbit of the satellite or because the ocean was covered by ice, which Aquarius cannot see through."[3]
"[T]he Atlantic Ocean is saltier than the Pacific and Indian Oceans. Rivers such as the Amazon carry tremendous amounts of fresh runoff from land and spread plumes far into the sea. And in the tropics—particularly near the Pacific’s Inter-Tropical Convergence Zone—extra rainfall makes equatorial waters somewhat fresher."[3]
"Near most coastlines and inland seas in the map, waters appear much fresher or saltier than in open-ocean locations. Look, for instance, at the Red Sea and the Mediterranean for saltier waters; significantly fresher waters appear in the Black Sea, in the icy high latitudes, and around the many islands and peninsulas of Southeast Asia. Indeed, runoff from rivers and melting ice does make water fresher, and strong evaporation and other processes do make the Red and Mediterranean Seas saltier. But mostly those extreme salinity measurements around the coastlines are a distortion of the satellite signal."[3]
"Technically, Aquarius measures the emissivity or “brightness temperature” of the surface waters, notes Gary Lagerloef, Aquarius principal investigator, based at Earth and Space Research in Seattle. Land masses have a higher emissivity than the ocean, so any measurement close to land tends to be skewed by its brightness. Over time, the Aquarius research team should be able to calibrate the measurements and develop mathematical tools to better distinguish the salt signal. But for now, the measurements are so new that the team is still working on the big picture of ocean salinity."[3]
“An overarching question in climate research is to understand how changes in the Earth’s water cycle—meaning rainfall and evaporation, river discharges and so forth—ocean circulation, and climate link together,” said Lagerloef.[3]
"Most global precipitation and evaporation events take place over the ocean and are very difficult to measure. But rainfall freshens the ocean’s surface waters, and Aquarius can detect these changes in saltiness."[3]
“Salinity is the variable we can use to measure that coupling. It’s a critical factor, and it will eventually be used to improve climate forecasts.”[3]
Aragonites
.png)
"Aragonite is a form of calcium carbonate that many marine animals use to build their skeletons and shells. Aragonite saturation is a ratio that compares the amount of aragonite that is actually present with the total amount of aragonite that the water could hold if it were completely saturated. The more negative the change in aragonite saturation, the larger the decrease in aragonite available in the water, and the harder it is for marine creatures to produce their skeletons and shells."[4]
"Measurements made over the last few decades have demonstrated that ocean carbon dioxide levels have risen in response to increased carbon dioxide in the atmosphere, leading to an increase in acidity (that is, a decrease in pH)"[4].
"Historical modeling suggests that since the 1880s, increased carbon dioxide has led to lower aragonite saturation levels (less availability of minerals) in the oceans around the world (see [above image])."[4]
"The largest decreases in aragonite saturation have occurred in tropical waters (see [above image]). However, decreases in cold areas may be of greater concern because colder waters typically have lower aragonite levels to begin with."[4]
Mixed layers
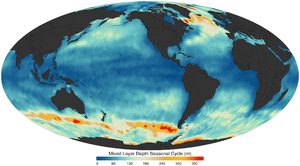
"The oceanic ... mixed layer is a layer in which active turbulence has homogenized [variables such as temperature and salinity to] some range of depths. The surface mixed layer is a layer where this turbulence is generated by winds, cooling, or processes such as evaporation or sea ice formation which result in an increase in salinity."[5]
"The mixed layer is characterized by being nearly uniform in properties such as temperature and salinity throughout the layer. Velocities, however, may exhibit significant shears within the mixed layer. The bottom of the mixed layer is characterized by a gradient, where the water properties change."[5]
"The depth of the mixed layer is often determined by hydrography—making measurements of water properties."[5]
Gulf Stream
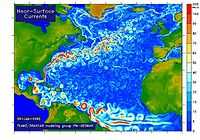
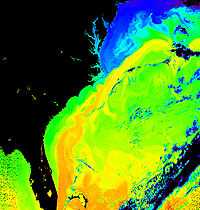
In the figure on the right, blue areas shows slower, yellow and red areas faster currents.
"In the middle of the Ocean, between Greenland and Norway and before Newfoundland, enormous masses of water disappear from the surface and plunge straight down to the bottom – thousands of meters deep, according to scientists. Like the drain-hole of a bathtub, this succion movement draws twenty times more water into the abyss than all the rivers of Earth together carry into the oceans."[6]
"This downward motion is the engine which from all appareances powers the whole global conveyer belt, the mighty system of water exchanges between the seas and oceans of Earth. The Gulfstream participates prominently in this so-called thermohaline circulation: in tropical regions, the sun heats up the surface waters and through evaporation, it increases the level of salinity. Additionally propulsed by winds and deviated by means of the Coriolis force created by the Earth’s rotation, the Gulfstream transports water from the Equator to the North."[6]
"But where are the mega-streams hiding?"[6]
"Where and how the water sinks down, we do not know.”[7]
"Despite the fact that scientific research vessels have been cruising the area for almost one hundred years, and that they have studied the ocean all the way to the bottom, and are constantly watching measurement buoys in the waters, scientists have been merely able to identify tiny downward swirls."[6]
"In the Sea of Labrador and in front of Greenland alone, 150 times more water is supposed to sink to the bottom than is driven into the ocean by the Amazon. But merely trickles have been found."[6]
The vertical twirls are “small and therefore not directly measurable. It’s a challenge, to have a measuring instrument at the ready in the right spot and at the right time.”[8]
"The search is made more difficult because the water apparently sinks only sporadically, and the areas of down-welling move around."[9]
The "colors [in the third figure down on the right] symbolize the repartition of temperatures on the surface of the water. In the red areas, it reaches up to 25° C."[6]
Hydrology
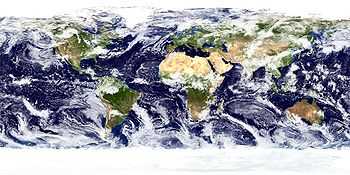
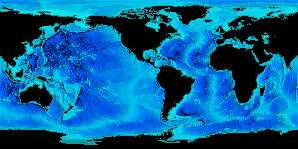
"This spectacular “blue marble” image is the most detailed true-color image of the entire Earth to date. Using a collection of satellite-based observations, scientists and visualizers stitched together months of observations of the land surface, oceans, sea ice, and clouds into a seamless, true-color mosaic of every square kilometer (.386 square mile) of our planet."[10]
"Much of the information contained in this image came from a single remote-sensing device-NASA’s Moderate Resolution Imaging Spectroradiometer, or MODIS. Flying over 700 km above the Earth onboard the Terra satellite, MODIS provides an integrated tool for observing a variety of terrestrial, oceanic, and atmospheric features of the Earth. The land and coastal ocean portions of these images are based on surface observations collected from June through September 2001 and combined, or composited, every eight days to compensate for clouds that might block the sensor’s view of the surface on any single day. Two different types of ocean data were used in these images: shallow water true color data, and global ocean color (or chlorophyll) data. Topographic shading is based on the GTOPO 30 elevation dataset compiled by the U.S. Geological Survey’s EROS Data Center. MODIS observations of polar sea ice were combined with observations of Antarctica made by the National Oceanic and Atmospheric Administration’s AVHRR sensor—the Advanced Very High Resolution Radiometer. The cloud image is a composite of two days of imagery collected in visible light wavelengths and a third day of thermal infra-red imagery over the poles."[10]
See also
- Dominant group/Geography
- Dominant group/Geology
- The Ocean Floor
References
- ↑ "Oceanography". Wikipedia (San Francisco, California: Wikimedia Foundation, Inc). April 22, 2012. http://en.wikipedia.org/wiki/Oceanography. Retrieved 2012-05-23.
- ↑ Michael Hahn (May 13, 2010). "Global Sea Surface Temperature". Goddard Space Flight Center. Retrieved 2013-02-27.
- 1 2 3 4 5 6 7 8 Norman Kuring, Robert Simmon, Mike Carlowicz, and Maria-Jose Vinas (June 12, 2012). "A Measure of Salt". NASA Earth Observatory. Retrieved 2013-02-27.
- 1 2 3 4 R.A. Feely, S.C. Doney, and S.R. Cooley (December 12, 2012). "Ocean Acidity". United States Environmental Protection Agency. Retrieved 2013-02-27.
- 1 2 3 "Mixed layer". Wikipedia (San Francisco, California: Wikimedia Foundation, Inc). January 22, 2013. http://en.wikipedia.org/wiki/Mixed_layer. Retrieved 2013-02-27.
- 1 2 3 4 5 6 Axel Bojanowski, translated by Anne-Marie de Grazia (24 July 24 2009). "Mega-Streams of the Atlantic Where are they hiding?". Der Spiegel. Retrieved 2015-01-13.
- ↑ Jochem Marotzke, translated by Anne-Marie de Grazia (24 July 24 2009). "Mega-Streams of the Atlantic Where are they hiding?". Der Spiegel. Retrieved 2015-01-13.
- ↑ Detlef Stammer, translated by Anne-Marie de Grazia (24 July 24 2009). "Mega-Streams of the Atlantic Where are they hiding?". Der Spiegel. Retrieved 2015-01-13.
- ↑ Detlef Quadfasel, translated by Anne-Marie de Grazia (24 July 24 2009). "Mega-Streams of the Atlantic Where are they hiding?". Der Spiegel. Retrieved 2015-01-13.
- 1 2 Reto Stöckli and Robert Simmon (February 8, 2002). "The Blue Marble: Land Surface, Ocean Color, Sea Ice and Clouds". Greenbelt, Maryland USA: NASA Visible Earth, NASA Goddard Space Flight Center. Retrieved 2013-02-28.
External links
- Antarctic Sea Ice (BAS)
- Earth and Ocean Sciences (University of British Columbia)
- Oceanography (University of British Columbia)
- Ocean Sciences (Bermuda Institute)
- Physical Oceanography (University of Liverpool)
- Sea Level and Climate, USGS
![]() This is a research project at http://en.wikiversity.org
This is a research project at http://en.wikiversity.org
| |
Development status: this resource is experimental in nature. |
| |
Educational level: this is a research resource. |
| |
Resource type: this resource is an article. |
| |
Resource type: this resource contains a lecture or lecture notes. |
| |
Subject classification: this is a science resource . |