Radiation astronomy/Microwaves
< Radiation astronomy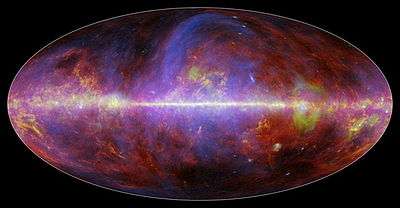
Astronomy specifically focused at the microwave portion of the electromagnetic spectrum is microwave astronomy.
Radiation
"Optics involves the behavior and properties of light, including its interactions with matter and the construction of instruments that use or detect it.[1] Optics usually describes the behavior of visible, ultraviolet, and infrared light. Because light is an electromagnetic wave, other forms of electromagnetic radiation such as X-rays, microwaves, and radio waves exhibit similar properties.[1]"[2]
"Microwaves, a subset of radio waves, have wavelengths ranging from as long as one meter to as short as one millimeter, or equivalently, with frequencies between 300 MHz (0.3 GHz) and 300 GHz.[3] This broad definition includes both [ultra high frequency] UHF and [extremely high frequency] EHF (millimeter waves), and various sources use different boundaries.[4] In all cases, microwave includes the entire [super high frequency] SHF band (3 to 30 GHz, or 10 to 1 cm) at minimum, with [radio frequency] RF engineering often putting the lower boundary at 1 GHz (30 cm), and the upper around 100 GHz (3 mm)."[5]
| Letter Designation | Frequency range | Wavelength range | Typical uses |
|---|---|---|---|
| L band | 1 to 2 GHz | 15 cm to 30 cm | military telemetry, GPS, mobile phones (GSM), amateur radio |
| S band | 2 to 4 GHz | 7.5 cm to 15 cm | weather radar, surface ship radar, and some communications satellites (microwave ovens, microwave devices/communications, radio astronomy, mobile phones, wireless LAN, Bluetooth, ZigBee, GPS, amateur radio) |
| C band | 4 to 8 GHz | 3.75 cm to 7.5 cm | long-distance radio telecommunications |
| X band | 8 to 12 GHz | 25 mm to 37.5 mm | satellite communications, radar, terrestrial broadband, space communications, amateur radio |
| Ku band or P band | 12 to 18 GHz | 16.7 mm to 25 mm | satellite communications |
| K band | 18 to 26.5 GHz | 11.3 mm to 16.7 mm | radar, satellite communications, astronomical observations, automotive radar |
| Ka band | 26.5 to 40 GHz | 5.0 mm to 11.3 mm | satellite communications |
| Q band | 33 to 50 GHz | 6.0 mm to 9.0 mm | satellite communications, terrestrial microwave communications, radio astronomy, automotive radar |
| U band | 40 to 60 GHz | 5.0 mm to 7.5 mm | |
| V band | 50 to 75 GHz | 4.0 mm to 6.0 mm | millimeter wave radar research and other kinds of scientific research |
| W band | 75 to 110 GHz | 2.7 mm to 4.0 mm | satellite communications, millimeter-wave radar research, military radar targeting and tracking applications, and some non-military applications, automotive radar |
| F band | 90 to 140 GHz | 2.1 mm to 3.3 mm | SHF transmissions: Radio astronomy, microwave devices/communications, wireless LAN, most modern radars, communications satellites, satellite television broadcasting, DBS, amateur radio |
| D band | 110 to 170 GHz | 1.8 mm to 2.7 mm | EHF transmissions: Radio astronomy, high-frequency microwave radio relay, microwave remote sensing, amateur radio, directed-energy weapon, millimeter wave scanner |
Planetary sciences
"Other important applications of gyrotrons are high-power microwave sources include high resolution radar ranging and imaging in atmospheric and planetary science as well as deep-space and specialized satellite communications and RF drivers for next-generation high-gradient linear accelerators".[6]
Colors
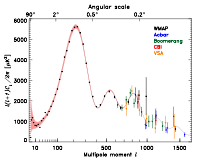
The figure at the right "shows the three-year WMAP spectrum compared to a set of recent balloon and ground-based measurements that were selected to most complement the WMAP data in terms of frequency coverage and l range. The non-WMAP data points are plotted with errors that include both measurement uncertainty and cosmic variance, while the WMAP data in this l range are largely noise dominated, so the effective error is comparable. When the WMAP data are combined with these higher resolution CMB measurements, the existence of a third acoustic peak is well established, as is the onset of Silk damping beyond the 3rd peak."[7]
Theoretical microwave astronomy
"Within the WMAP frequency range, it is difficult to distinguish between a primordial CMB spectrum and a thermal SZ [Sunyaev-Zeldovich (SZ) fluctuations] spectrum, so we adopt the Komatsu & Seljak (2002) model for the SZ power spectrum and marginalize over the amplitude as a nuisance parameter."[7]
Entities
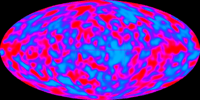
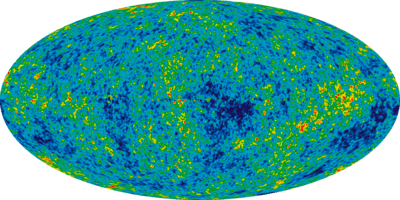
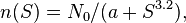
Compare the COBE all-sky CMB at right with the map from WMAP in the background section.
"The cosmic microwave background fluctuations are extremely faint, only one part in 100,000 compared to the 2.73 degree Kelvin average temperature of the radiation field."[8]
Sources
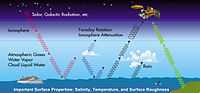
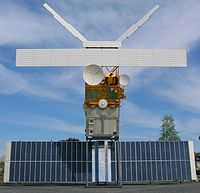
"Many natural sources, besides salinity, contribute to the microwave radiation at L-band frequencies (approximately 1 gigahertz) measured by satellites. Correcting the influence of these natural sources is a key to obtaining Aquarius’ accurate salinity measurements."[9]
"Aquarius is dedicated to making precise measurements of ocean salinity over months and years, providing important new information for climate studies. It will produce monthly maps of the surface salinity of the global ocean with a 93-mile (150-kilometer) resolution and an accuracy of 0.2 practical salinity units, which is equal to about one-eighth teaspoon of salt in a gallon of water. (Practical salinity is a scale used to describe the concentration of dissolved salts in seawater, nearly equivalent to parts per thousand.) The mission is to make these measurements continuously for at least three years."[9]
"The radiometers on Aquarius measure the microwave emissions from the sea surface at 1.4 gigahertz in the L-band portion of the electromagnetic spectrum. This energy, which is measured as an equivalent temperature called the "brightness temperature" in Kelvin, has a direct correlation to surface salinity."[9]
Electromagnetics
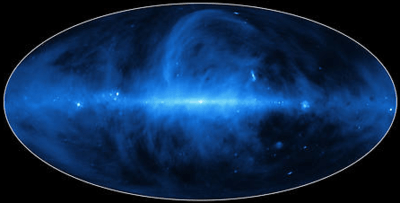
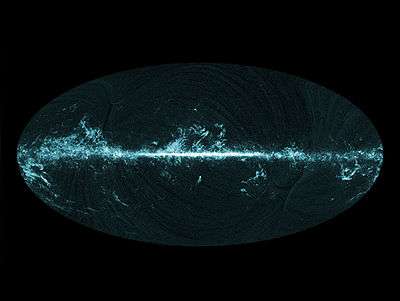
The image above center shows the magnetics field of the Milky Way galaxy via charged particles moving along it.
Weak forces
The Gravity Recovery and Climate Experiment (GRACE) "mission uses a microwave ranging system to accurately measure changes in the speed and distance between two identical spacecraft flying in a polar orbit about 220 kilometers (140 mi) apart, 500 kilometers (310 mi) above Earth. The ranging system is sensitive enough to detect separation changes as small as 10 micrometres (approximately one-tenth the width of a human hair) over a distance of 220 kilometers.[10]"[11]
"As the twin GRACE satellites circle the globe 15 times a day, they sense minute variations in Earth's gravitational pull. When the first satellite passes over a region of slightly stronger gravity, a gravity anomaly, it is pulled slightly ahead of the trailing satellite. This causes the distance between the satellites to increase. The first spacecraft then passes the anomaly, and slows down again; meanwhile the following spacecraft accelerates, then decelerates over the same point."[11]
Emissions
The "discovery of the anomalous dust-correlated microwave emission (AME) in the galaxy [was] by Leitch et al (1997) [18] [Characteristics include]
- the AME constitutes a foreground emission to cosmic microwave background (CMB) radiation. [...]
- it provides a window into the properties of small grains, which play crucial roles for the physics and chemistry of the ISM.
- [It is a] diffuse and localized AME"[12]
"In the case of electric dipole radiation, the associated fluctuation in angular momentum is due to absorption of and decays stimulated by microwave photons (dominated by Cosmic Microwave Background (CMB) photons in the diffuse ISM)."[12]
"The [warm ionized medium] WIM is characterized by a large gas temperature T ≈ 8000 K, and a fully ionized gas at low density, nH+ ≈ 0.1 cm-3. Collisions with ions provide the dominant excitation mechanism. Grains are mostly negatively charged due to the high rate of sticking collisions with high-velocity electrons. For a coronene molecule, the characteristic time between ion collisions and the characterstic rotational damping time at the peak angular momentum τrot = √ττed turn out to be comparable6, of order a few years."[12]
The "peak emissivity is enhanced by about 23% for the WIM [and only 11 % for the warm neutral medium (WNM)], although the peak frequency remains unchanged."[12]
"A more important effect on the spectrum is that of increasing the characteristic internal temperature Tω, which makes the grains wobble rather than simply spin about their axis of greatest inertia."[12]
For triaxiality there is an "additional enhancement of the peak frequency and total power by up to the same factors (~ 30 % and 2, respectively) for a large internal relaxation temperature and highly elliptical grains."[12]
Absorptions
"The 111 → 110 rotational transition of formaldehyde (H2CO) [occurs] in absorption in the direction of four dark nebulae. The radiation ... being absorbed appears to be the isotropic microwave background".[13] One of the dark nebulae sampled, per SIMBAD is TGU H1211 P5.
Backgrounds
"[B]ackground radiation may simply be any radiation that is pervasive, whether ionizing or not. A particular example of this is the cosmic microwave background radiation, a nearly uniform glow that fills the sky in the microwave part of the spectrum; stars, galaxies and other objects of interest in radio astronomy stand out against this background."[14]
The image at the top shows the "detailed, all-sky picture of the infant universe created from nine years of WMAP data. The image reveals 13.77 billion year old temperature fluctuations (shown as color differences) that correspond to the seeds that grew to become the galaxies. The signal from the our Galaxy was subtracted using the multi-frequency data. This image shows a temperature range of ± 200 microKelvin."[15]
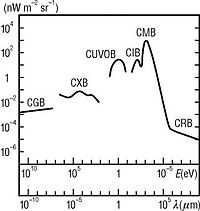
In the figure at right, CUVOB stands for the cosmic ultraviolet and optical background. "The diffuse extragalactic background light (EBL) is all the accumulated radiation in the Universe due to star formation processes, plus a contribution from active galactic nuclei (AGNs). This radiation covers the wavelength range between ~ 0.1-1000 microns (these are the ultraviolet, optical, and infrared regions of the electromagnetic spectrum). The EBL is part of the diffuse extragalactic background radiation (DEBRA), which by definition covers the overall electromagnetic spectrum. After the cosmic microwave background, the EBL produces the second-most energetic diffuse background, thus being essential for understanding the full energy balance of the universe."[16]
Cosmic rays
Notation: let the symbol GZK represent Greisen-Zatsepin-Kuzmin.
"[B]ased on interactions between cosmic rays and the photons of the cosmic microwave background radiation (CMB) ... cosmic rays with energies over the threshold energy of 5x10¹⁹ eV ... interact with cosmic microwave background photons  to produce pions via the
  resonance,"[17]

or

Neutrals
"Pions produced in this manner proceed to decay in the standard pion channels—ultimately to photons for neutral pions, and photons, positrons, and various neutrinos for positive pions. Neutrons decay also to similar products, so that ultimately the energy of any cosmic ray proton is drained off by production of high energy photons plus (in some cases) high energy electron/positron pairs and neutrino pairs."[17]
Protons
"The pion production process begins at a higher energy than ordinary electron-positron pair production (lepton production) from protons impacting the CMB, which starts at cosmic ray proton energies of only about 1017eV. However, pion production events drain 20% of the energy of a cosmic ray proton as compared with only 0.1% of its energy for electron positron pair production. This factor of 200 is from two sources: the pion has only about ~130 times the mass of the leptons, but the extra energy appears as different kinetic energies of the pion or leptons, and results in relatively more kinetic energy transferred to a heavier product pion, in order to conserve momentum. The much larger total energy losses from pion production result in the pion production process becoming the limiting one to high energy cosmic ray travel, rather than the lower-energy light-lepton production process."[17]
Mesons
"The pion production process continues until the cosmic ray energy falls below the pion production threshold. Due to the mean path associated with this interaction, extragalactic cosmic rays traveling over distances larger than 50 Mpc (163 Mly) and with energies greater than this threshold should never be observed on Earth. This distance is also known as GZK horizon."[17]
Beta particles
"The attenuation of photons in the microwave background via the process

is strongly energy dependent, with a minimum attenuation length of ≈ 7 kpc around 2.5 PeV, as determined by the threshold for e+e- production (Gould and Schreder, 1966; Jelley, 1966)."[18]
Electrons
A "PeV energy photon cannot deliver information from a source at the edge of our own galaxy because it will annihilate into an electron [positron] pair in an encounter with a 2.7 Kelvin microwave photon before reaching our telescope."[19]
"In general, energetic photons above a threshold E given by

where E and ε are the energy of the high-energy and background photon, respectively. [This] implies that TeV-photons are absorbed on infrared light, PeV photons on the cosmic microwave background and EeV photons on radio-waves".[19]
"Each [optical module] OM contains a 10 inch [photo-multiplier tube] PMT that detects individual photons of Cerenkov light generated in the optically clear ice by muons and electrons moving with velocities near the speed of light."[19]
"Radio Cerenkov experiments detect the Giga-Hertz pulse radiated by shower electrons produced in the interaction of neutrinos in ice."[19]
"Above a threshold of ≃ 1PeV, the large number of low energy(≃ MeV ) photons in a shower will produce an excess of electrons over positrons by removing electrons from atoms by Compton scattering. These are the sources of coherent radiation at radio frequencies, i.e. above ∼ 100MHz."[19]
Gamma rays
"Gamma-ray bursts (GRBs) are flashes of gamma rays associated with extremely energetic explosions that have been observed in distant galaxies. They are the most luminous electromagnetic events known to occur in the universe. Bursts can last from ten milliseconds to several minutes, although a typical burst lasts 20–40 seconds. The initial burst is usually followed by a longer-lived "afterglow" emitted at longer wavelengths (X-ray, ultraviolet, optical, infrared, microwave and radio).[20]"[21]
Submillimeters
"Submillimetre astronomy or submillimeter astronomy ... is the branch of observational astronomy that is conducted at submillimetre wavelengths of the electromagnetic spectrum. Astronomers place the submillimetre waveband between the far-infrared and microwave wavebands, typically taken to be between a few hundred micrometres and a millimetre." and "Using submillimetre observations, astronomers examine molecular clouds and dark cloud cores with a goal of clarifying the process of star formation from earliest collapse to stellar birth."[22]
Radars
"Radar astronomy is a technique of observing nearby astronomical objects by reflecting microwaves off target objects and analyzing the echoes. This research has been conducted for six decades. Radar astronomy differs from radio astronomy in that the latter is a passive observation and the former an active one. Radar systems have been used for a wide range of solar system studies. The radar transmission may either be pulsed or continuous."[23]
Radios
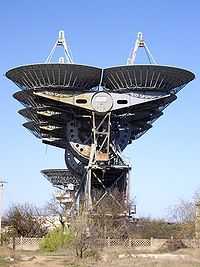
Several satellites have served as observatories for radio waves and specifically for microwaves. The Radio Astronomy Explorer (RAE) 1 is launched into orbit on July 4, 1968, around Earth, while the [Explorer 49] RAE 2 is launched on June 10, 1973, around the Moon.
The COBE is launched into Earth orbit on November 18, 1989. The WMAP is launched on June 30, 2001, into orbit at the [Lissajous orbit] Lagrange 2 location. Both satellites have aboard detectors designed to perform microwave astronomy, as these are limited to only the microwave band.
Superluminals
"We propose a method for estimating the composition, i.e. the relative amounts of leptons and protons, of extragalactic jets which exhibit X-ray bright knots in their kpc scale jets. The method relies on measuring, or setting upper limits on, the component of the Cosmic Microwave Background (CMB) radiation that is bulk-Comptonized by cold electrons in the relativistically flowing jet. These measurements, along with modeling of the broadband knot emission that constrain the bulk Lorentz factor Γ of the jets, can yield estimates of the jet power carried by protons and leptons. We provide an explicit calculation of the spectrum of the bulk-Comptonized (BC) CMB component and apply these results to PKS 0637–752 and 3C 273, two superluminal quasars with Chandra – detected large scale jets."[24]
Rocky objects
"The Askaryan effect is the phenomenon whereby a particle traveling faster than the phase velocity of light in a dense dielectric (such as salt, ice or the lunar regolith) produces a shower of secondary charged particles which contain a charge anisotropy and thus emits a cone of coherent radiation in the radio or microwave part of the electromagnetic spectrum. It is similar to the Cherenkov effect."[25]
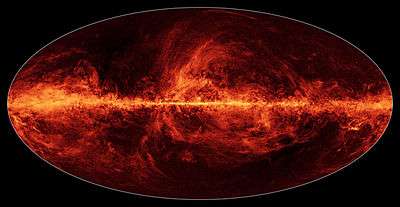
"The red [image at center shows] the heat coming from dust throughout the Milky Way galaxy. Planck can capture this thermal light even though the dust is extremely cold — about minus 420 Fahrenheit (minus 251 Celsius)."[26]
Astrochemistry
"The detection of interstellar formaldehyde provides important information about the chemical physics of our galaxy. We now know that polyatomic molecules containing at least two atoms other than hydrogen can form in the interstellar medium."[27] "H2CO is the first organic polyatomic molecule ever detected in the interstellar medium".[27]
Hydrogens
“The hydrogen line, 21 centimeter line or HI line refers to the electromagnetic radiation spectral line that is created by a change in the energy state of neutral hydrogen atoms. This electromagnetic radiation is at the precise frequency of 1420.40575177 [megahertz] MHz, which is equivalent to the vacuum wavelength of 21.10611405413 cm in free space. This wavelength or frequency falls within the microwave radio region of the electromagnetic spectrum, and it is observed frequently in radio astronomy, since those radio waves can penetrate the large clouds of interstellar cosmic dust that are opaque to visible light.”[28]
Ions
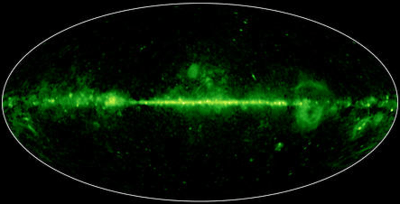
Charged particle interactions around the galaxy are shown in the image above using microwaves as detected by the Planck satellite.
Molecules
"This all-sky image [above center] shows the distribution of carbon monoxide (CO), a molecule used by astronomers to trace molecular clouds across the sky, as seen by Planck."[29]
Compounds
"So far the effect has been observed in silica sand,[30] rock salt,[31] and ice[32].[33]"[25]
Atmospheres
At the right is a plot of the zenith atmospheric microwave transmission on the summit of Mauna Kea, Earth, in the gigahertz range at a precipitable water vapor level of 0.001 mm.
Spectrometers
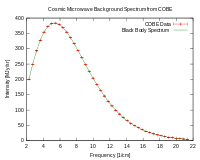
“[C]osmic microwave background (CMB) radiation (also CMBR, CBR, MBR, and relic radiation) is thermal radiation filling the observable universe almost uniformly.[35]”[36]
“Precise measurements of cosmic background radiation are critical to cosmology, since any proposed model of the universe must explain this radiation. The CMBR has a thermal black body spectrum at a temperature of 2.725 K,[37] which peaks at the microwave range frequency of 160.2 GHz, corresponding to a 1.873 mm wavelength. This holds if measured per unit frequency, as in Planck's law. If measured instead per unit wavelength, using Wien's law, the peak is at 1.06 mm corresponding to a frequency of 283 GHz.”[36]
"The differential 850-μm counts are well described by the function
where  is the flux in mJy,
  = 3.0 × 10⁴ per square degree per mJy, and
  = 0.4 − 1.0 is chosen to match the 850-μm extragalactic background light."[38]
Sun
At right is a radio image of the Sun at 4.6 GHz. "The brightest discrete radio source is the Sun, but it is much less dominant than it is in visible light. The radio sky is always dark, even when the Sun is up, because atmospheric dust doesn't scatter radio waves, whose wavelengths are much longer than the dust particles."[39]
"The quiet Sun at 4.6 GHz imaged by the [Very Large Array] VLA with a resolution of 12 arcsec, or about 8400 km on the surface of the Sun. The brightest features (red) in this false-color image have brightness temperatures ~ 106 K and coincide with sunspots. The green features are cooler and show where the Sun's atmosphere is very dense. At this frequency the radio-emitting surface of the Sun has an average temperature of 3 x 10⁴ K, and the dark blue features are cooler yet. The blue slash crossing the bottom of the disk is a feature called a filament channel, where the Sun's atmosphere is very thin: it marks the boundary of the South Pole of the Sun. The radio Sun is somewhat bigger than the optical Sun: the solar limb (the edge of the disk) in this image is about 20000 km above the optical limb."[39]
"The microwave radiation from the sun was observed during the partial eclipse of July 9, 1945."[40]
Moon
"On October 19, 1945, at 10:25 P.M., E.S.T., the effective black-body temperature of the nearly full moon was measured to be 292° K."[40]
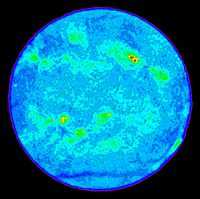
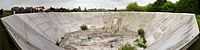
"Very precise microwave measurements between two spacecraft, named Ebb and Flow, were used to map gravity with high precision and high spatial resolution. The field shown resolves blocks on the surface of about 12 miles (20 kilometres) and measurements are three to five orders of magnitude improved over previous data. Red corresponds to mass excesses and blue corresponds to mass deficiencies. The map shows more small-scale detail on the far side of the moon compared to the nearside because the far side has many more small craters."[41]
"Twin NASA probes orbiting Earth's moon have generated the highest resolution gravity field map of any celestial body. The new map, created by the Gravity Recovery and Interior Laboratory (GRAIL) mission, is allowing scientists to learn about the moon's internal structure and composition in unprecedented detail. Data from the two washing machine-sized spacecraft also will provide a better understanding of how Earth and other rocky planets in the solar system formed and evolved."[41]
"The gravity field map reveals an abundance of features never before seen in detail, such as tectonic structures, volcanic landforms, basin rings, crater central peaks and numerous simple, bowl-shaped craters. Data also show the moon's gravity field is unlike that of any terrestrial planet in our solar system."[42]
""What this map tells us is that more than any other celestial body we know of, the moon wears its gravity field on its sleeve," said GRAIL Principal Investigator Maria Zuber of the Massachusetts Institute of Technology in Cambridge. "When we see a notable change in the gravity field, we can sync up this change with surface topography features such as craters, rilles or mountains.""[42]
"According to Zuber, the moon's gravity field preserves the record of impact bombardment that characterized all terrestrial planetary bodies and reveals evidence for fracturing of the interior extending to the deep crust and possibly the mantle. This impact record is preserved, and now precisely measured, on the moon. The probes revealed the bulk density of the moon's highland crust is substantially lower than generally assumed. This low-bulk crustal density agrees well with data obtained during the final Apollo lunar missions in the early 1970s, indicating that local samples returned by astronauts are indicative of global processes."[42]
""With our new crustal bulk density determination, we find that the average thickness of the moon's crust is between 21 and 27 miles (34 and 43 kilometres), which is about 6 to 12 miles (10 to 20 kilometres) thinner than previously thought," said Mark Wieczorek, GRAIL co-investigator at the Institut de Physique du Globe de Paris. "With this crustal thickness, the bulk composition of the moon is similar to that of Earth. This supports models where the moon is derived from Earth materials that were ejected during a giant impact event early in solar system history.""[42]
"The map was created by the spacecraft transmitting radio signals to define precisely the distance between them as they orbit the moon in formation. As they fly over areas of greater and lesser gravity caused by visible features, such as mountains and craters, and masses hidden beneath the lunar surface, the distance between the two spacecraft will change slightly."[42]
""We used gradients of the gravity field in order to highlight smaller and narrower structures than could be seen in previous datasets," said Jeff Andrews-Hanna, a GRAIL guest scientist with the Colorado School of Mines in Golden. "This data revealed a population of long, linear gravity anomalies, with lengths of hundreds of kilometres, crisscrossing the surface. These linear gravity anomalies indicate the presence of dikes, or long, thin, vertical bodies of solidified magma in the subsurface. The dikes are among the oldest features on the moon, and understanding them will tell us about its early history.""[42]
Uranus
“Photometry over the course of half a Uranian year (beginning in the 1950s) has shown regular variation in the brightness in two spectral bands, with maxima occurring at the solstices and minima occurring at the equinoxes.[43] A similar periodic variation, with maxima at the solstices, has been noted in microwave measurements of the deep troposphere begun in the 1960s.[44] Stratospheric temperature measurements beginning in the 1970s also showed maximum values near the 1986 solstice.[45] The majority of this variability is believed to occur owing to changes in the viewing geometry.[46]"[47]
"Detailed analysis of the visible and microwave data revealed that the periodical changes of brightness are not completely symmetrical around the solstices, which also indicates a change in the meridional albedo patterns.[48]"[47] Finally in the 1990s, as Uranus moved away from its solstice, Hubble and ground based telescopes revealed that the south polar cap darkened noticeably (except the southern collar, which remained bright),[49] while the northern hemisphere demonstrated increasing activity,[50] such as cloud formations and stronger winds, bolstering expectations that it should brighten soon.[51] This indeed happened in 2007 when the planet passed an equinox: a faint northern polar collar arose, while the southern collar became nearly invisible, although the zonal wind profile remained slightly asymmetric, with northern winds being somewhat slower than southern.[52]”[47]
Recent history
The recent history period dates from around 1,000 b2k to present.
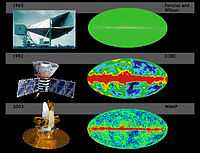
"Penzias and Wilson discovered the remnant afterglow from the Big Bang and were awarded the Nobel Prize for their discovery. COBE first discovered the patterns in the afterglow. WMAP will bring the patterns into much better focus to unveil a wealth of information about the history and fate of the universe."[53]
in the figure at the right, specifically the top left (TL) is the "Penzias and Wilson microwave receiver - 1965"[53], (TR) a "Simulation of the sky viewed by Penzias and Wilson's microwave receiver - 1965"[53], (ML) "COBE Spacecraft, Painting - 1992"[53], (MR) "COBE's view of early universe- 1992"[53], (BL) "WMAP Spacecraft, Computer Rendering - 2001"[53], and (BR) "Simulated WMAP view of early universe"[53].
Sciences
The submillimeter, millimeter, and microwave spectral line catalog is "a computer-accessible catalog of submillimeter, millimeter, and microwave spectral lines in the frequency range between 0 and 10 000GHz (ie wavelengths longer than 30μm)."[54]
Clocks
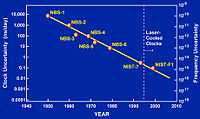
"An atomic clock is a clock device that uses an electronic transition frequency in the microwave, optical, or ultraviolet region[55] of the electromagnetic spectrum of atoms as a frequency standard for its timekeeping element. Atomic clocks are the most accurate time and frequency standards known, and are used as primary standards for international time distribution services, to control the wave frequency of television broadcasts, and in global navigation satellite systems such as GPS."[56]
Low noise amplifiers
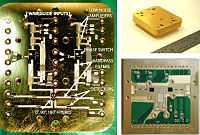
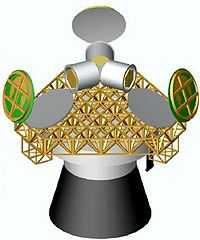
At right is an image of the QUIET module, a pseudo-correlation receiver comprising low noise amplifiers, phase shifters, detector diodes, and passive components. On the left is the first QUIET module which includes the "low noise amplifiers[, an] InP monolithic microwave integrated circuit (MMIC) high electron mobility transistor (HEMT) amplifiers."[57] The upper right shows "an earlier prototype 90 GHz module. The modules are 1.25 x 1.14."[57] The lower right is "the interior of a (2 x 2) 40 GHz module."[57]
"Both Q and U are measured simultaneously by a single QUIET module with the introduction of an appropriate optical element: a circularly polarized orthomode transducer (OMT)."[57]
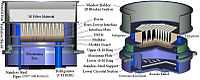
At second right are schematic views "of a QUIET cryostat shown with a 91 element array of W-band modules."[57]
"The horns are held at ≈ 20 K and shielded from 300K radiation by a radiation shield (shown only in the figure on the left) held at ≈ 80 K on the top and sides and the aluminum plate (also 80K) on the bottom."[57]
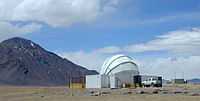
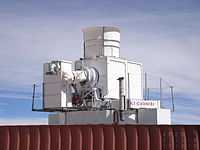
The third right image is of the QUIET telescope. "The 2m design [...] accommodates 400 W-band receivers or 100 Q-band receivers, with each mirror machined as a single piece. [The] three 2m systems, [are] accommodated on the CBI platform as indicated in [the third right image]. The design uses two reflectors of approximately equal size in a crossed arrangement, and is known as a side fed Cassegrain (or crossed Dragone system). The primary mirror is parabolic and the secondary is a concave hyperboloid. By correctly selecting the angle between the two reflectors, a system that has a wide field of view with minimal cross-polarization results."[57]
"The site [in the image on the left] for the QUIET telescopes [in the second left image with its dome down] is the Chajnantor scientific reserve in Chile, at an altitude of 5080 m. This site is recognized as one of the best in the world for millimeter and submillimeter astronomy. The site belongs to the state of Chile and is leased to the international Atacama Large Millimeter Array project (ALMA)."[57]
Spacecraft
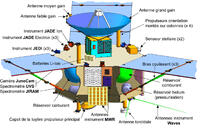
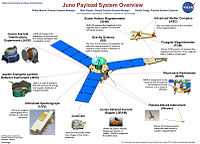
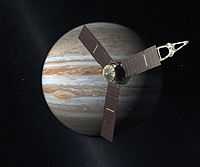
"The [Juno] spacecraft is built around a hexagonal cylinder bus measuring 3.5 m in diameter by 3.5 m high. Three solar panel wings extend from alternate sides of the hexagon giving a total diameter of approximately 20 m. A high gain antenna is mounted on top of the bus, with instruments mounted on the deck and propellant, oxygen, and pressurant tanks mounted within. At the center of the top deck is a 0.8 x 0.8 x 0.6 m titanium "vault" which houses the spacecraft avionics and critical systems to protect them from the severe jovian radiation environment. The vault has a mass of 150 kg and walls up to over a cm in thickness. Power is provided by ultra triple junction GaAs solar cells, covered with thick glass for radiation shielding, which are grouped into 11 solar panels, four on two of the wings and three on the other. (The end of the third wing is a boom structure holding science instruments.) The solar panels will produce a total of 18 kW at Earth and 400 W initially at Jupiter. The science payload comprises ten instruments: the Jovian Auroral Distributions Experiment (JADE), the Jupiter Energetic-particle Detector Instrument (JEDI), the Ultraviolet Spectrograph (UVS), the JunoCam, the Jovian Infrared Auroral Mapper (JIRAM), the Plasma Waves Instrument (Waves), the Microwave radiometer (MWR), the Fluxgate Magnetometer (FGM), the Advanced Stellar Compass (ASC), the Scalar Helium Magnetometer (SHM), and the Gravity Science experiment."[58] Bold added.
Microwave telescopes
"The basic scientific goal of the Planck mission is to measure [cosmic microwave background] CMB anisotropies at all angular scales larger than 10 arcminutes over the entire sky with a precision of ~2 parts per million. The model payload consists of a 1.5 meter off-axis telescope with two focal plane arrays of detectors sharing the focal plane. Low frequencies will be covered by 56 tuned radio receivers sensitive to 30-100 GHz, while high frequencies will be covered by 56 bolometers sensitive to 100-850 GHz."[59]
Wilkinson microwave anisotropy probe
"The Wilkinson Microwave Anisotropy Probe (WMAP) is a Medium-class Explorer (MIDEX) mission designed to elucidate cosmology by producing full-sky maps of the cosmic microwave background (CMB) anisotropy."[7]
Explorer 66
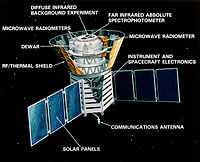
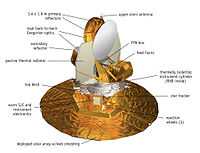
The Cosmic Background Explorer (COBE) has aboard a differential microwave radiometer (DMR) labeled in the diagram at right.
The E and B experiment
"The E and B Experiment (EBEX) will measure the cosmic microwave background radiation of a part of the sky during two sub-orbital (high altitude) balloon flights. It is an experiment to make large, high-fidelity images of the CMB polarization anisotropies. By using a telescope which flies at over 42,000 metres high, it is possible to reduce the atmospheric absorption of microwaves to a minimum. This allows massive cost reduction compared to a satellite probe, though only a small part of the sky can be scanned and for shorter duration than a typical satellite mission such as WMAP."[60]
"EBEX was launched on 29 December, 2012, near McMurdo Station in Antarctica.[61][62]"[60]
"EBEX is meant to hone in on one specific feature of the CMB light that's been predicted, but never seen — a signature called B-type polarization, thought to have been produced by the gravity waves created by the universe's extremely rapid infant expansion, which happened even before the CMB light was released."[63]
Explorer 49
Several satellites have served as observatories for radio waves and specifically for microwaves.
“Explorer 49 [is] a 328 kilogram satellite launched on June 10, 1973 for longwave radio astronomy research. It had four 230-meter long X-shaped antenna elements, which made it one of the largest spacecraft ever built. ... Explorer 49 was placed into lunar orbit to provide radio astronomical measurements of the planets, the sun, and the galaxy over the frequency range of 25 kHz to 13.1 MHz.”[64]
Cosmic Anisotropy Telescope
"The Cosmic Anisotropy Telescope (CAT), built in the mid 1990s, was the first interferometer to measure fluctuations in the cosmic microwave background (CMB). Its first results, published in 1996, were the highest resolution CMB detection at that time, and showed that the rise in fluctuation power towards scales of ~1 degree (l ~ 200) measured by the Saskatoon experiment were matched by a decline in power at smaller angles (l = 500-700), thus showing the existence of the long-predicted acoustic peak in the CMB power spectrum."[65]
Orbital platforms
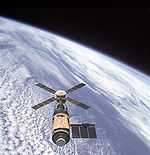
“Skylab included an Apollo Telescope Mount, which was a multi-spectral solar observatory, ... Numerous scientific experiments were conducted aboard Skylab during its operational life, and crews were able to confirm the existence of coronal holes in the Sun. The Earth Resources Experiment Package (EREP), was used to view the Earth with sensors that recorded data in the visible, infrared, and microwave spectral regions.”[66]
Sun-synchronous orbital rocketry
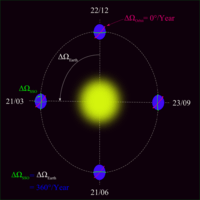
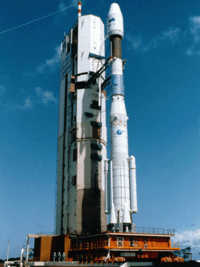
"A Sun-synchronous orbit (sometimes called a heliosynchronous orbit[67]) is a geocentric orbit which combines altitude and inclination in such a way that an object on that orbit ascends or descends over any given Earth latitude at the same local mean solar time. The surface illumination angle will be nearly the same every time. This consistent lighting is a useful characteristic for satellites that image the Earth's surface in visible or infrared wavelengths (e.g. weather and spy satellites) and for other remote sensing satellites (e.g. those carrying ocean and atmospheric remote sensing instruments that require sunlight). For example, a satellite in sun-synchronous orbit might ascend across the equator twelve times a day each time at approximately 15:00 mean local time. This is achieved by having the osculating orbital plane precess (rotate) approximately one degree each day with respect to the celestial sphere, eastward, to keep pace with the Earth's movement around the Sun.[68]"[69]
"The uniformity of Sun angle is achieved by tuning the inclination to the altitude of the orbit ... such that the extra mass near the equator causes the orbital plane of the spacecraft to precess with the desired rate: the plane of the orbit is not fixed in space relative to the distant stars, but rotates slowly about the Earth's axis. Typical sun-synchronous orbits are about 600–800 km in altitude, with periods in the 96–100 minute range, and inclinations of around 98° (i.e. slightly retrograde compared to the direction of Earth's rotation: 0° represents an equatorial orbit and 90° represents a polar orbit).[68]"[69]
"European remote sensing satellite (ERS) was the European Space Agency's first Earth-observing satellite. It was launched on July 17, 1991 into a Sun-synchronous polar orbit at a height of 782–785 km."[70]
"ERS-1 carried an array of earth-observation instruments that gathered information about the Earth (land, water, ice and atmosphere) using a variety of measurement principles. These included:"[70]
- RA (Radar Altimeter) is a single frequency nadir-pointing radar altimeter operating in the Ku band.
- ATSR-1 (Along-Track Scanning Radiometer) is a 4 channel infrared radiometer and microwave sounder for measuring temperatures at the sea-surface and the top of clouds.
- SAR (synthetic aperture radar) operating in C band can detect changes in surface heights with sub-millimeter precision.
- Wind Scatterometer used to calculate information on wind speed and direction.
- MWR is a Microwave Radiometer used in measuring atmospheric water, as well as providing a correction for the atmospheric water for the altimeter.
"To accurately determine its orbit, the satellite included ... a Laser Retroreflector. ... The Retroreflector was used for calibrating the Radar Altimeter to within 10 cm."[70]
"Its successor, ERS-2, was launched on April 21, 1995, on an Ariane 4, from ESA's Guiana Space Centre near Kourou, French Guiana. Largely identical to ERS-1, it added additional instruments and included improvements to existing instruments including:
- GOME (Global Ozone Monitoring Experiment) is a nadir scanning ultraviolet and visible spectrometer.
- ATSR-2 included 3 visible spectrum bands specialized for Chlorophyll and Vegetation"[70]
Research
Hypothesis:
- Once literature searching has brought you to the state of the science, it is time to prepare an original research effort. Control groups and proof of concept are tools that can help to verify a model approach to an astronomical phenomenon.
Control groups

The findings demonstrate a statistically systematic change from the status quo or the control group.
“In the design of experiments, treatments [or special properties or characteristics] are applied to [or observed in] experimental units in the treatment group(s).[71] In comparative experiments, members of the complementary group, the control group, receive either no treatment or a standard treatment.[72]"[73]
Proof of concept
Def. a “short and/or incomplete realization of a certain method or idea to demonstrate its feasibility"[74] is called a proof of concept.
Def. evidence that demonstrates that a concept is possible is called proof of concept.
The proof-of-concept structure consists of
- background,
- procedures,
- findings, and
- interpretation.[75]
See also
References
- 1 2 McGraw-Hill Encyclopedia of Science and Technology (5th ed.). McGraw-Hill. 1993.
- ↑ "Optics, In: Wikipedia". San Francisco, California: Wikimedia Foundation, Inc. July 1, 2012. Retrieved 2012-07-07.
- ↑ Pozar, David M. (1993). Microwave Engineering Addison-Wesley Publishing Company. ISBN 0-201-50418-9.
- ↑ http://www.google.com/search?hl=en&defl=en&q=define:microwave&ei=e6CMSsWUI5OHmQee2si1DQ&sa=X&oi=glossary_definition&ct=title
- ↑ "Microwave, In: Wikipedia". San Francisco, California: Wikimedia Foundation, Inc. September 10, 2012. Retrieved 2012-09-17.
- ↑ Liu Ying-hui; Li Hong-fu ; Li Hao ; Wang E-feng ; Xu Yong ; Sun Yu (September 18-22, 2006). Analysis of RF Field in Open Cavity by Mode-Matching Technique, In: Infrared Millimeter Waves and 14th International Conference on Teraherz Electronics. Shanghai: IEEE. pp. 78. doi:10.1109/ICIMW.2006.368286. ISBN 1-4244-0400-2. http://ieeexplore.ieee.org/xpls/abs_all.jsp?arnumber=4222020. Retrieved 2013-10-20.
- 1 2 3 G. Hinshaw, M. R. Nolta, C. L. Bennett, R. Bean, O. Doré, M. R. Greason, M. Halpern, R. S. Hill, N. Jarosik, A. Kogut, E. Komatsu, M. Limon, N. Odegard, S. S. Meyer, L. Page, H. V. Peiris, D. N. Spergel, G. S. Tucker, L. Verde, J. L. Weiland, E. Wollack, and E. L. Wright (5 January 2007). "Three-Year Wilkinson Microwave Anisotropy Probe (WMAP1) Observations: Temperature Analysis". The Astrophysical Journal (Supplement Series) 170 (2): 288-334. doi:10.1086/513698. http://arxiv.org/pdf/astro-ph/0603451.pdf. Retrieved 2014-10-19.
- ↑ "DMR Images". Greenbelt, Maryland USA: NASA Goddard Space Flight Center. 10 April 2013. Retrieved 2014-10-19.
- 1 2 3 Rosemary Sullivant (May 31, 2011). "Aquarius Studying Our Salty Seas From Space". Pasadena, California USA: Jet Propulsion Laboratory, NASA. Retrieved 2014-01-08.
- ↑ "GRACE Launch Press Kit". NASA/JPL.
- 1 2 "Gravity Recovery and Climate Experiment, In: Wikipedia". San Francisco, California: Wikimedia Foundation, Inc. November 20, 2012. Retrieved 2012-12-14.
- 1 2 3 4 5 6 Yacine Ali-Haïmoud (2013). "Spinning dust radiation: a review of the theory". Advances in Astronomy 2013 (462697). doi:10.1155/2013/462697. http://arxiv.org/pdf/1211.2748v1.pdf. Retrieved 2014-10-19.
- ↑ Patrick Palmer, B. Zuckerman, David Buhl, and Lewis E. Snyder (June 1969). "Formaldehyde Absorption in Dark Nebulae". The Astrophysical Journal 156 (6): L147-50. doi:10.1086/180368.
- ↑ "Background radiation, In: Wikipedia". San Francisco, California: Wikimedia Foundation, Inc. April 6, 2013. Retrieved 2013-04-12.
- ↑ David T. Chuss. "Nine Year Microwave Sky". Greenbelt, Maryland USA: NASA Goddard Space Flight Center. Retrieved 2014-10-18.
- ↑ "Extragalactic background light, In: Wikipedia". San Francisco, California: Wikimedia Foundation, Inc. March 15, 2013. Retrieved 2013-05-03.
- 1 2 3 4 "Greisen–Zatsepin–Kuzmin limit, In: Wikipedia". San Francisco, California: Wikimedia Foundation, Inc. May 14, 2012. Retrieved 2012-08-22.
- ↑ Thomas K. Gaisser (1990). Cosmic Rays and Particle Physics. Cambridge University Press. pp. 279. ISBN 0521339316. http://books.google.com/books?hl=en&lr=&id=qJ7Z6oIMqeUC&oi=fnd&pg=PR15&ots=IxjwLxBwXu&sig=voHKIYstBlBYla4jcbur_b-Zwxs. Retrieved 2014-01-11.
- 1 2 3 4 5 Francis Halzen and Dan Hooper (June 12, 2002). "High-energy neutrino astronomy: the cosmic ray connection". Reports on Progress in Physics 65 (7): 1025-107. doi:10.1088/0034-4885/65/7/201. http://iopscience.iop.org/0034-4885/65/7/201. Retrieved 2014-02-08.
- ↑ Vedrenne, G and Atteia, J.-L. (2009). Gamma-Ray Bursts: The brightest explosions in the Universe. Springer/Praxis Books. ISBN 978-3-540-39085-5. http://books.google.com/?id=jZHSdrvzz0gC&printsec=frontcover#v=onepage&q&f=false.
- ↑ "Gamma-ray burst, In: Wikipedia". San Francisco, California: Wikimedia Foundation, Inc. September 3, 2012. Retrieved 2012-09-17.
- ↑ "Submillimetre astronomy, In: Wikipedia". San Francisco, California: Wikimedia Foundation, Inc. June 2, 2012. Retrieved 2012-06-08.
- ↑ "Radar astronomy, In: Wikipedia". San Francisco, California: Wikimedia Foundation, Inc. July 30, 2012. Retrieved 2012-08-30.
- ↑ Markos Georganopoulos, Demosthenes Kazanas, Eric Perlman, and Floyd W. Stecker (2005). "Bulk Comptonization of the Cosmic Microwave Background by Extragalactic Jets as a Probe of their Matter Content". The Astrophysical Journal 625: 656-66. doi:10.1086/429558. http://arxiv.org/pdf/astro-ph/0502201v2.pdf. Retrieved 2014-10-18.
- 1 2 "Askaryan effect, In: Wikipedia". San Francisco, California: Wikimedia Foundation, Inc. July 28, 2012. Retrieved 2012-08-22.
- ↑ Calla Cofield (06 February 2015). "Spectacular Milky Way Maps Show Our Galaxy in New Light". Space.com. Retrieved 2015-11-16.
- 1 2 Lewis E. Snyder, David Buhl, B. Zuckerman, Patrick Palmer (March 1969). "Microwave detection of interstellar formaldehyde". Physical Review Letters 22 (13): 679-81. doi:10.1103/PhysRevLett.22.679. http://link.aps.org/doi/10.1103/PhysRevLett.22.679. Retrieved 2011-12-17.
- ↑ "Hydrogen line, In: Wikipedia". San Francisco, California: Wikimedia Foundation, Inc. August 23, 2012. Retrieved 2012-08-29.
- ↑ SPACE.com Staff (06 February 2015). "Planck All-Sky Image of Carbon Monoxide". Space.com. Retrieved 2015-11-16.
- ↑ Observation of the Askaryan Effect in Silica Sand
- ↑ Observation of the Askaryan Effect in Rock Salt
- ↑ P. W. Gorham, S. W. Barwick, J. J. Beatty, D. Z. Besson, W. R. Binns, C. Chen, P. Chen, J. M. Clem, A. Connolly, P. F. Dowkontt, M. A. DuVernois, R. C. Field, D. Goldstein, A. Goodhue, C. Hast, C. L. Hebert, S. Hoover, M. H. Israel, J. Kowalski, J. G. Learned, K. M. Liewer, J. T. Link, E. Lusczek, S. Matsuno, B. Mercurio, C. Miki, P. Miocinovic, J. Nam, C. J. Naudet, J. Ng, R. Nichol, K. Palladino, K. Reil, A. Romero-Wolf, M. Rosen, D. Saltzberg, D. Seckel, G. S. Varner, D. Walz, F. Wu (October 25, 2007). "Observations of the Askaryan Effect in Ice". Physical Review Letters 99 (17): 5. doi:10.1103/PhysRevLett.99.171101. http://adsabs.harvard.edu/cgi-bin/bib_query?arXiv:hep-ex/0611008. Retrieved 2013-11-05.
- ↑ Nikolai G. Lehtinen and Peter W. Gorham, Abram R. Jacobson and Robert A. Roussel-Dupre ́ (January 2004). "FORTE satellite constraints on ultrahigh energy cosmic particle fluxes". Physical Review D 69 (1): 013008-1 to 14. doi:10.1103/PhysRevD.69.013008. http://ees.lanl.gov/ees2/pdfs/Lehtinen_2004.pdf. Retrieved 2012-09-02.
- ↑ White, M. (1999). Anisotropies in the CMB. UCLA. Bibcode: 1999dpf..conf.....W.
- ↑ Penzias, A.A.; Wilson, R.W. (1965). "A Measurement of Excess Antenna Temperature at 4080 Mc/s". Astrophysical Journal 142: 419–421. doi:10.1086/148307.
- 1 2 "Cosmic microwave background radiation, In: Wikipedia". San Francisco, California: Wikimedia Foundation, Inc. August 20, 2012. Retrieved 2012-08-29.
- ↑ Fixsen, D. J. (December 2009). "The Temperature of the Cosmic Microwave Background". The Astrophysical Journal 707 (2): 916–920. doi:10.1088/0004-637X/707/2/916.
- ↑ A. J. Barger, L. L. Cowie, D. B. Sanders (June 10, 1999). "Resolving the submillimeter background: the 850 micron galaxy counts". The Astrophysical Journal 518 (1): L5-8. doi:10.1086/312054. http://iopscience.iop.org/1538-4357/518/1/L5. Retrieved 2013-10-22.
- 1 2 S.G. Djorgovski et al. (16 March 2014). "A Tour of the Radio Universe". National Radio Astronomy Observatory. Retrieved 2014-03-16.
- 1 2 Robert H. Dicke and Robert Beringer (May 1946). "Microwave Radiation from the Sun and Moon". The Astrophysical Journal 103 (05): 375-6. doi:10.1086/144819. http://adsabs.harvard.edu/abs/1946ApJ...103..375D. Retrieved 2014-10-18.
- 1 2 Tony Greicius (December 6, 2012). "GRAIL's Gravity Map of the Moon". NASA/JPL-Caltech/MIT/GSFC. Retrieved 2012-12-15.
- 1 2 3 4 5 6 PR Newswire (December 5, 2012). "NASA Twin Spacecraft Create Most Accurate Gravity Map Of Moon". Retrieved 2012-12-15.
- ↑ Lockwood, G. W.; Jerzykiewicz, Mikołaj A. (February 2006). "Photometric variability of Uranus and Neptune, 1950–2004". Icarus 180 (2): 442–452. Bibcode 2006Icar..180..442L. doi:10.1016/j.icarus.2005.09.009.
- ↑ Klein, M. J.; Hofstadter, M. D. (September 2006). "Long-term variations in the microwave brightness temperature of the Uranus atmosphere". Icarus 184 (1): 170–180. Bibcode 2006Icar..184..170K. doi:10.1016/j.icarus.2006.04.012.
- ↑ Young, Leslie A.; Bosh, Amanda S.; Buie, Marc; et al. (2001). "Uranus after Solstice: Results from the 1998 November 6 Occultation" (PDF). Icarus 153 (2): 236–247. doi:10.1006/icar.2001.6698. http://www.boulder.swri.edu/~layoung/eprint/ur149/Young2001Uranus.pdf.
- ↑ Karkoschka, Erich (May 2001). "Uranus' Apparent Seasonal Variability in 25 HST Filters". Icarus 151 (1): 84–92. Bibcode 2001Icar..151...84K. doi:10.1006/icar.2001.6599.
- 1 2 3 "Uranus, In: Wikipedia". San Francisco, California: Wikimedia Foundation, Inc. June 5, 2012. Retrieved 2012-06-08.
- ↑ Hammel, H.B.; Lockwood, G.W. (2007). "Long-term atmospheric variability on Uranus and Neptune". Icarus 186: 291–301. doi:10.1016/j.icarus.2006.08.027.
- ↑ Rages, K. A.; Hammel, H. B.; Friedson, A. J. (11 September 2004). "Evidence for temporal change at Uranus' south pole". Icarus 172 (2): 548–554. Bibcode 2004Icar..172..548R. doi:10.1016/j.icarus.2004.07.009
- ↑ Emily Lakdawalla (2004). "No Longer Boring: 'Fireworks' and Other Surprises at Uranus Spotted Through Adaptive Optics". The Planetary Society. Archived from the original on May 25, 2006. Retrieved June 13, 2007.
- ↑ Hammel, H. B.; de Pater, I.; Gibbard, S. G.; Lockwood, G. W.; Rages, K. (May 2005). "New cloud activity on Uranus in 2004: First detection of a southern feature at 2.2 µm" (PDF). Icarus 175 (1): 284–288. Bibcode 2005Icar..175..284H. doi:10.1016/j.icarus.2004.11.016.
- ↑ Sromovsky, L. A.; Fry, P. M. (December 2005). "Dynamics of cloud features on Uranus". Icarus 179 (2): 459–484. Bibcode 2005Icar..179..459S. doi:10.1016/j.icarus.2005.07.022.
- 1 2 3 4 5 6 7 Penzias, Wilson, NASA (2003). "A Brief History of Background Radiation, Microwave Sky Comparison, 1965 - 2003". Greenbelt, Maryland USA: NASA Goddard Space Flight Center. Retrieved 2014-10-18.
- ↑ H.M. Pickett, R.L. Poynter, E.A. Cohen, M.L. Delitsky, J.C. Pearson, and H.S.P. Müller (1998). "Submillimeter, millimeter, and microwave spectral line catalog". Journal of Quantitative Spectroscopy and Radiative Transfer 60 (5): 883-90. http://www.sciencedirect.com/science/article/pii/S0022407398000910. Retrieved 2014-03-14.
- ↑ Dennis McCarthy, P. Kenneth Seidelmann (2009). TIME from Earth Rotation to Atomic Physics. Weinheim: Wiley-VCH. ch. 10 & 11.
- ↑ "Atomic clock, In: Wikipedia". San Francisco, California: Wikimedia Foundation, Inc. October 12, 2012. Retrieved 2012-10-24.
- 1 2 3 4 5 6 7 8 Immanuel Buder (30 December 2009). "QUIET Instrumentation". Chicago, Illinois: University of Chicago. Retrieved 2014-10-18.
- ↑ David R. Williams (August 16, 2013). "Juno". Washington, DC USA: National Space Science Data Center, NASA. Retrieved 2014-01-08.
- ↑ David T. Chuss (April 18, 2008). "The Planck Mission". Greenbelt, Maryland USA: Goddard Space Flight Center. Retrieved 2013-12-12.
- 1 2 "The E and B Experiment, In: Wikipedia". San Francisco, California: Wikimedia Foundation, Inc. December 30, 2012. Retrieved 2013-02-05.
- ↑ Blog post from a member of the EBEX science team describing the launch.
- ↑ YouTube video of the EBEX launch.
- ↑ Clara Moskowitz (February 4, 2013). "Balloon-Borne Telescope Seeks Out Elusive Big Bang Signal". Yahoo! News. Retrieved 2013-02-05.
- ↑ "Explorer 49, In: Wikipedia". San Francisco, California: Wikimedia Foundation, Inc. June 18, 2012. Retrieved 2012-08-29.
- ↑ Astrophysics Group, Cavendish Laboratory (2013). "The Cosmic Anisotropy Telescope (CAT)". University of Cambridge, UK: Mullard Radio Astronomy Observatory. Retrieved 2014-10-19.
- ↑ "Skylab, In: Wikipedia". San Francisco, California: Wikimedia Foundation, Inc. 19 September 2014. Retrieved 2014-10-19.
- ↑ Shcherbakova, N. N.; Beletskij, V. V.; Sazonov, V. V. - Kosmicheskie Issledovaniia, Tom 37, No. 4, p. 417 - 427, see http://adsabs.harvard.edu/abs/1999KosIs..37..417S
- 1 2 M. Rosengren: ERS-1 - An Earth Observer that exactly follows its Chosen Path, ESA Bulletin number 72, November 1992
- 1 2 "Sun-synchronous orbit, In: Wikipedia". San Francisco, California: Wikimedia Foundation, Inc. October 10, 2012. Retrieved 2012-12-05.
- 1 2 3 4 "European Remote-Sensing Satellite, In: Wikipedia". San Francisco, California: Wikimedia Foundation, Inc. November 20, 2012. Retrieved 2012-12-05.
- ↑ Klaus Hinkelmann, Oscar Kempthorne (2008). Design and Analysis of Experiments, Volume I: Introduction to Experimental Design (2nd ed.). Wiley. ISBN 978-0-471-72756-9. http://books.google.com/?id=T3wWj2kVYZgC&printsec=frontcover.
- ↑ R. A. Bailey (2008). Design of comparative experiments. Cambridge University Press. ISBN 978-0-521-68357-9. http://www.cambridge.org/uk/catalogue/catalogue.asp?isbn=9780521683579.
- ↑ "Treatment and control groups, In: Wikipedia". San Francisco, California: Wikimedia Foundation, Inc. May 18, 2012. Retrieved 2012-05-31.
- ↑ "proof of concept, In: Wiktionary". San Francisco, California: Wikimedia Foundation, Inc. November 10, 2012. Retrieved 2013-01-13.
- ↑ Ginger Lehrman and Ian B Hogue, Sarah Palmer, Cheryl Jennings, Celsa A Spina, Ann Wiegand, Alan L Landay, Robert W Coombs, Douglas D Richman, John W Mellors, John M Coffin, Ronald J Bosch, David M Margolis (August 13, 2005). "Depletion of latent HIV-1 infection in vivo: a proof-of-concept study". Lancet 366 (9485): 549-55. doi:10.1016/S0140-6736(05)67098-5. http://www.ncbi.nlm.nih.gov/pmc/articles/PMC1894952/. Retrieved 2012-05-09.
External links
- Hit counter To see how often this page is viewed, enter Wikiversity, then the page title.
- African Journals Online
- Bing Advanced search
- Google Books
- Google scholar Advanced Scholar Search
- International Astronomical Union
- JSTOR
- Lycos search
- NASA/IPAC Extragalactic Database - NED
- NASA's National Space Science Data Center
- NCBI All Databases Search
- Office of Scientific & Technical Information
- PubChem Public Chemical Database
- Questia - The Online Library of Books and Journals
- SAGE journals online
- The SAO/NASA Astrophysics Data System
- Scirus for scientific information only advanced search
- SDSS Quick Look tool: SkyServer
- SIMBAD Astronomical Database
- SIMBAD Web interface, Harvard alternate
- Spacecraft Query at NASA.
- SpringerLink
- Taylor & Francis Online
- Universal coordinate converter
- Wiley Online Library Advanced Search
- Yahoo Advanced Web Search
![]() This is a research project at http://en.wikiversity.org
This is a research project at http://en.wikiversity.org
| |
Development status: this resource is experimental in nature. |
| |
Resource type: this resource is an article. |
| |
Resource type: this resource contains a lecture or lecture notes. |
| |
Subject classification: this is an astronomy resource. |