How to use R/Tutorials/Plotting
< How to use R < TutorialsThis tutorial demonstrates how to plot data in R.
Note
- This stub content was copied from an import of b:R Programming/Tutorial originally to How to use R/Tutorials/Introduction.
Load the data
- Given the data file data.txt located at <path>:
1970    45    63
1980    52    59
1990    59    52
2000    63    45
- This data can easily be loaded into R using the following commands:
setwd("<path>")                # change working directory
data <- read.table("data.txt")  # load data
Plot the data
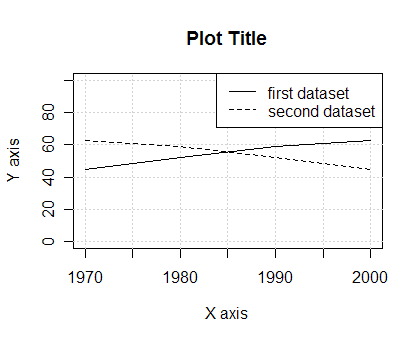
- Plotting can then be performed as follows:
# Setup empty plot window
plot(0, type = "n", main = "Plot Title", xlab = "X axis", ylab = "Y axis", xlim = c(1970,2000), ylim = c(0,100))
grid()                              # add grid
lines(data[,1], data[,2], lty = 1)  # draw first dataset
lines(data[,1], data[,3], lty = 2)  # draw second dataset
legend("topright", c("first dataset", "second dataset"), lty = c(1, 2) )
- Export of the plot to pdf is easilty performed by adding pdf("filename.pdf") prior to the plotting, and dev.off() after the plotting.
- Export to png can simmilarly be performed by calling png("filename.png") prior to the plotting, and dev.off() after the plotting. png("r_plot.png", width = 420, height = 340) will, for example yield the following figure:
This article is issued from Wikiversity - version of the Tuesday, December 15, 2009. The text is available under the Creative Commons Attribution/Share Alike but additional terms may apply for the media files.