Confidence interval
Confidence intervals (CIs) (or confidence limits) provide information about the "reliability" of a statistical parameter - or "range of certainty" or "area of confidence". Rather than rely on a single estimate for a parameter (such as a measure of central tendency, a CI approach specifies a likely range within which the population central tendency for a variable of interest is likely to be. For example, if we measure the heights of a sample of human beings, the mean might be 170cm. From this sample, we might conclude that the mean height for the entire population is 95% likely to be between 168cm and 172cm (a lower and upper confidence level respectively). CIs are an alternative or adjunct approach to statistical inference. CIs are very useful and are underutilised. This page provides an undergraduate-level introduction to confidence intervals and their usage. |
CI types
Confidence intervals can be reported for any paramater of a sample:
- Ms
- M differences (M2 – M1)
- Effect sizes
- β (standardised regression coefficient) in multiple linear regression
CIs can be examined statistically and graphically (e.g., error-bar graphs)
CI for a mean
- e.g., true M is 95% likely to lie between -1.96 SD and +1.96 of the sample M
- CI is based on the M, SD, N, and critical ά, calculate:
- Lower-limit (e.g., .025 for 95% CI)
- Upper-limit (e.g., .975 for 95% CI)
CIs and error bar graphs

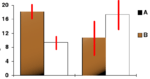
- CIs around means can be presented as error bar graphs
- More informative alternatives to bar graphs or line graphs
- For representing the central tendency and distribution of continuous data for different groups
Review question
- Q
If I have a sample M = 5, with 95% CI of 2.5 to 7.5, what would I conclude?
- Accept H0 that the M is equal to 0.
- Reject H0 that the M is equal to 0.
- A
- 2
- Q
If I have a sample M = 5, with 95% CI of -.5 to 11.5, what would I conclude?
- Accept H0 that the M is equal to 0.
- Reject H0 that the M is equal to 0.
- A
- 1
See also
- Confidence interval {Wikipedia)