Chemicals
Chemicals is a lecture on the general nature and specific characteristics of various natural and hominin-made substances. It is an offering from the school of chemistry.
Chemistry
Def. a "natural science that deals with the composition and constitution of substances and the changes that they undergo as a consequence of alterations in the constitution of their molecules"[1] is called chemistry.
Def. a science that deals with
- the identification of the substances of which matter is composed,
- the investigation of their properties and the ways in which they interact, combine, and change, and
- the use of these processes to form new substances
is called chemistry.
Def. "a science that deals with the composition, structure, and properties of substances and of the transformations that they undergo"[2] is called chemistry.
"Chemistry is the science of matter, especially its chemical reactions, but also its composition, structure and properties.[3][4] Chemistry is concerned with atoms and their interactions with other atoms, and particularly with the properties of chemical bonds."[5]
Theoretical chemicals
Def. any "specific [...] element or [...] compound or alloy"[6] is called a chemical.
Hydrogens
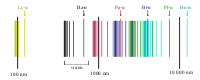
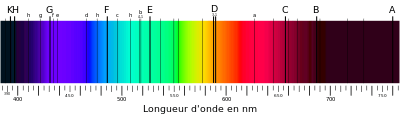
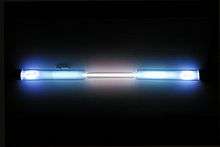
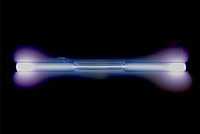
"The emission spectrum of atomic hydrogen is divided into a number of spectral series, with wavelengths given by the Rydberg formula. These observed spectral lines are due to electrons moving between energy levels in the atom. The spectral series are important in astronomy for detecting the presence of hydrogen and calculating red shifts. ... [T]he spectral lines of hydrogen correspond to particular jumps of the electron between energy levels. The simplest model of the hydrogen atom is given by the Bohr model. When an electron jumps from a higher energy to a lower, a photon of a specific wavelength is emitted."[7]
"The spectral lines are grouped into series according to n'. Lines are named sequentially starting from the longest wavelength/lowest frequency of the series, using Greek letters within each series. For example, the 2 → 1 line is called "Lyman-alpha" (Ly-α), while the 7 → 3 line is called "Paschen-delta" (Pa-δ). Some hydrogen spectral lines fall outside these series, such as the 21 cm line; these correspond to much rarer atomic events such as hyperfine transitions.[8] The fine structure also results in single spectral lines appearing as two or more closely grouped thinner lines, due to relativistic corrections.[9]"[7].
"The energy differences between levels in the Bohr model, and hence the wavelengths of emitted/absorbed photons, is given by the Rydberg formula[10]:
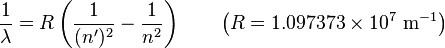
where n is the initial energy level, n′ is the final energy level, and R is the Rydberg constant. Meaningful values are returned only when n is greater than n′ and the limit of one over infinity is taken to be zero."[7]
"The familiar red H-alpha [Hα 656 nm] spectral line of hydrogen gas, which is the transition from the shell n = 3 to the Balmer series shell n = 2, is one of the conspicuous colors of the universe. It contributes a bright red line to the spectra of emission or ionization nebula, like the Orion Nebula, which are often H II regions found in star forming regions. In true-color pictures, these nebula have a distinctly pink color from the combination of visible Balmer lines that hydrogen emits."[11]
"A hydrogen-alpha filter is an optical filter designed to transmit a narrow bandwidth of light generally centered on the H-alpha wavelength. They are characterized by a bandpass width that measures the width of the wavelength band that is transmitted.[12] These filters are manufactured by multiple (~50) layers of vacuum-deposited layers. These layers are selected to produce interference effects that filter out any wavelengths except at the requisite band.[13] Alternatively, an etalon may be used as the narrow band filter (in conjunction with a "blocking filter" or energy rejection filter) to pass only a narrow (<0.1 nm) range of wavelengths of light centred around the H-alpha emission line. The physics of the etalon and the dichroic interference filters are essentially the same (relying on constructive/destructive interference of light reflecting between surfaces), but the implementation is different (an interference filter relies on the interference of internal reflections). Due to the high velocities sometimes associated with features visible in H-alpha light (such as fast moving prominences and ejections), solar H-alpha etalons can often be tuned (by tilting or changing the temperature) to cope with the associated Doppler effect."[14]
The Balmer series of emission lines from hydrogen occur in the visible spectrum of the Sun at: 397, 410, 434, 486, and 656 nm.
Hydrogen has two emission lines that occur in an electron cyclotron resonance (ECR) heated plasmas at 397.007 nm of the Balmer series (Hε) and 434.05 nm Hγ.[15]
Heliums
"C. FRIEDLÄNDER and H. Kayser have independently claimed to have found helium in the [Earth's] atmosphere. On examination of some photographs of the spectrum of neon I have identified six of the principal lines of helium, which thus establishes beyond question the presence of this gas in the air. The amount present in the neon it is, of course, impossible to estimate, but the green line (wave-length 5016 [501.6 nm]) is the brightest, as would be expected from the low pressure of the helium in the neon."[16]
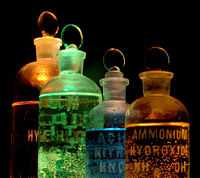
Liquid helium as shown on the right is just above absolute zero in temperature.
Helium is a "colorless and inert gas".[17]
Helium is a noble gas.
Lithiums

"[T]he standard solar models have enjoyed tremendous success recently in terms of agreement between the predicted outer structure and the results from helioseismology[, but] some observed properties of the Sun still defy explanation, such as the degree of Li depletion" [the "solar Li abundance is roughly a factor of 200 below the meteoritic abundance"].[18]
Berylliums
Beryllium has at least six emission/absorption lines across the red.
The emission and absorption spectra for beryllium contain lines in the blue.
Above is a light spectrum of the emission and absorption lines of neutral, atomic beryllium. Important for violet astronomy is the apparent absence of strong lines well within the violet range and one strong line on the fringe of the violet and blue portions of the visual spectrum.
"Good agreement is seen between the 14C (Fig. 8a) and 10Be (Fig. 8b) records, which confirms they are indeed measuring changes of the GCR flux, since their respective transport processes from the atmosphere to archive are completely different. After its formation, 14C is rapidly oxidised to 14CO2 and then enters the carbon cycle and may reach a tree-ring archive. On the other hand, 10Be attaches to aerosols and eventually settles as rain or snow, where it may become embedded in a stable ice-sheet archive. The correlation between high GCR flux and cold North Atlantic temperatures embraces the Little Ice Age, which is seen not as an isolated phenomenon but rather as the most recent of around ten such events during the Holocene. This suggests that the Sun may spend a substantial fraction of time in a magnetically-quiet state."[19]
Notation: let the symbol DPM represent Diesel vehicle exhaust Particulate Matter.
"Moreover DPM can bear metals like antimony, arsenic, beryllium, cadmium, chromium, copper, iron, lead, magnesium, manganese, nickel, vanadium and zinc ... the dominant group of particles had a diameter of 20 to 25 nm (at 900 rpm 50% load or 25 to 30 nm 100% load) for individual soot nodules."[20]
Borons
Boron has a red line near the orange portion of the visual spectrum.
Above is a light spectrum of the emission and absorption lines of neutral, atomic boron. Important for violet astronomy is the two strong lines well within the violet range and one weaker line on the fringe of the violet and blue portions of the visual spectrum.
The emission and absorption spectra for boron contain lines on the border between violet and blue.
"The proton-proton chain, or hydrogen burning, is postulated by standard stellar theory as the principal mechanism of energy generation in the sun during the current stage of its evolution. The net result of this chain of nuclear reactions is conversion of four protons into helium-4, and the energy released is carried off by photons, positrons, and neutrinos."[21]
The "pH change for deep Pacific Ocean water associated with both the 3% increase in salinity resulting from the growth of the ice caps and the 700-m deepening of the lysocline9 are so small that they would lie within the uncertainty of pH reconstruction based on boron isotopes. If the glacial to Holocene drop in pH (0.3 units) suggested by the boron isotope measurements on benthic foraminifera was mainly accomplished by excess CaCO2 accumulation, then the alkalinity of deep Pacific water must have been ~10% higher during glacial time. As a result, the carbonate ion concentration of deep Pacific water during glacial time would have been ~100 µmol kg-1 higher than the present-day value, deepening the calcite saturation horizon by several kilometres."[22]
For the "reedmergnerite unit, BSi4O10 ... The spectra showed small amounts of it, and we saw no evidence of fragmentation (i.e., no corresponding smaller fragments that would appear to be constituents). Thus, it does not appear to be the dominant group in the glass network. ... The borate association remains dominant, however, even as we increase the soda content."[23]
Carbons
Carbon has an emission line in plasmas at 529.053 nm from C VI.[15]
"The [oxygen] green line occurs at 5577.339Å, in the middle of the strong C2 (1,2) band, and thus has seldom been observed."[24]
Carbon has one strong line in the red.
Carbon has three emission lines that occur in an electron cyclotron resonance (ECR) heated plasmas: 464.742, 465.025, and 465.147 nm from C III.[15]
Carbon has an emission line that occurs in plasmas at 449.881 nm from C VI.[15]
From the spectrum above, carbon has at least two lines in the violet.
"In general, during 1990-1991 most of the carbon biomass was contributed by diatoms, while during 1992-1993 it was contributed mainly by flagellates, although during Leg II of 1993 dinoflagellates were the dominant group in terms of carbon content."[25]
Nitrogens
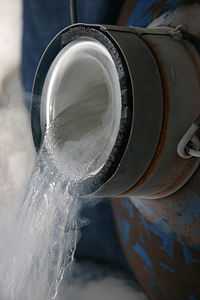
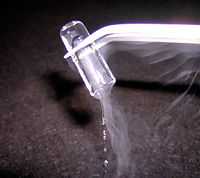
On the right liquid nitrogen is shown being poured.
"Molecular nitrogen (N2) [is] a colorless, odorless gas at room temperature."[26]
Oxygens

"[A]irglow emissions [have been] measured by using vertical-viewing photometers [for the] O(1S) green line at 557.7 nm [with a] background at 566 nm"[27].
The O III emission lines are at 495.9 and 500.7 nm.[28]
Oxygen has an emission line that occurs in plasmas at 527.62 nm from O IV.[15]
"Since the early work of Ångström,* we have the published records of over a hundred investigations on the spectrum, and many others on the origin or other phenomena characteristic of the aurora."[29] "Babcock, using a Fabry and Perot interferometer, determined very accurately the wave-length of the auroral green line 5577. ... After a careful examination of all the results obtained in these reports, we may only say that the exact nature of the cosmical rays, responsible for the aurora, remains a mystery. ... The origin of the most prominent and interesting line of the auroral spectrum, the line 5577, has hitherto remained unexplained. Vegard* has recently obtained a luminescent band from solid nitrogen, that he supposes, under very special conditions, may coincide with the auroral green line. ... spectra of pure helium and of pure oxygen were taken at different pressures and with various excitations, but no trace of 5577 or of any other new lines was obtained. ... Mixtures of helium, oxygen and nitrogen were excited, and it was found that the line 5577 could be photographed on the same plate with the nitrogen band system, thus reproducing in the laboratory practically the entire auroral spectrum. In ... mixtures of neon and oxygen ... neon enhanced the line 5577 in the same manner as helium. ... From Plate 20 it will be seen that all the lines except 5577 have been identified as strong lines in the spectrum of helium, hydrogen, oxygen, or mercury. ... It has been shown that this line must be attributed to some hitherto unknown spectrum of oxygen, and that it is not a limiting member of the ordinary band spectrum of oxygen. It has been observed faintly in highly purified oxygen when currents of high density have been used."[29]
Oxygen (O I) has two red lines at 630.0 and 636.4 nm. In the red there are the atomic oxygen transitions of the "forbidden oxygen red doublet at 6300.304 and 6363.776 Å (1D - 3P)"[30]. Atmospheric O2 has a red line at 686.72 nm.
"The oxygen abundance [may be determined] using the oxygen forbidden line at 630nm"[31]. "[R]atios [of] O/Fe ... are in agreement with the ratios found in the metal-poor red giants, suggesting that no real difference exists between dwarfs and giants."[31]
"The forbidden oxygen line (λ 630.03nm) is weak in dwarf stars"[31]
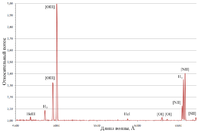
In the spectrum at right several red astronomy emission lines are detected and recorded at normalized intensities (to the oxygen III line) from the Ring Nebula. In the red are the two forbidden lines of oxygen ([O I], 630.0 and 636.4 nm), two forbidden lines of nitrogen ([N II], 654.8 nm and [N II], 658.4 nm), the hydrogen line (Hα, 656.3 nm) and a forbidden line of sulfur ([S II], 671.7 nm).
The spectrum above shows the lines in the visible due to emission from elemental oxygen.
Oxygen has several emission lines that occur in an electron cyclotron resonance (ECR) heated plasmas: 406.963, 406.99, 407.22, 407.59, 407.89, 408.51, 435.12, 441.489, and 441.697 nm from O II, and 434.045 nm from O VIII.[15]
"Electron temperatures are generally derived from the ratio of auroral to nebular lines in [O III] or [N II]."[32] "[B]ecause of the proximity of strong night-sky lines at λ4358 and λλ5770, 5791, the auroral lines of [O III] λ4363 and [N II] λ5755 are often contaminated."[32]
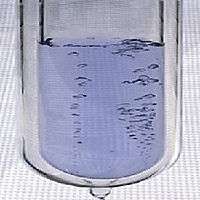
Liquid oxygen as shown on the right may not be perfectly clear.
"Liquid oxygen has a pale blue color and is strongly paramagnetic and can be suspended between the poles of a powerful horseshoe magnet. Liquid oxygen has a density of 1.141 kg/L and is cryogenic. freezing point: 50.5 K (-368.77 °F; -222.65 °C), boiling point: 90.19 K (-297.33 °F, -182.96 °C) at 101.325 kPa (760 mmHg)."[33]
"Molecular oxygen (O2) [is] a colorless, odorless gas at room temperature."[34]
"Plasma cleaning involves the removal of impurities and contaminants from surfaces through the use of an energetic plasma created from gaseous species. Gases such as argon and oxygen, as well as mixtures such as air and hydrogen/nitrogen are used. The plasma is created by using high frequency voltages (typically kHz to >MHz) to ionise the low pressure gas (typically around 1/1000 atmospheric pressure), although atmospheric pressure plasmas are now also common."[35]
"Oxygen-isotope analyses of ice and firn from the Saskatchewan Glacier, Canada, and the Malaspina Glacier, Alaska, show that variations in ratios are likely to be of considerable value in glaciological research."[36]
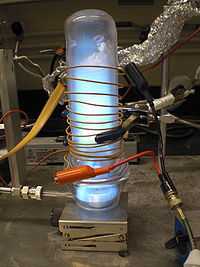
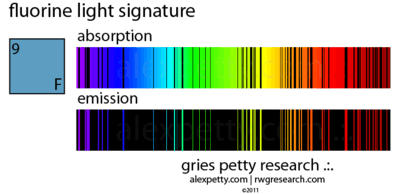
Fluorines
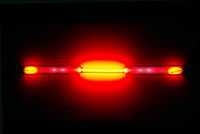
Fluorine has green emission lines that occur in plasmas at 526.83, 528.56, 529.76 and 530.27 nm from F VI.[15]
"Fluorine abundances for red giants of type K, Ba, M, MS, S, SC,N, and J [may be] obtained from the [infrared] rotation-vibration lines of the molecule HF. There appears to be a clear correlation between [F/O] and 12C/16O since N stars display F abundances up to 30 times the solar system value. This correlation points toward the He-burning shell as the site of F synthesis. The nuclear chain 14N(α,γ)18F(β+)18O(p,α)15N(α,γ)19F (where protons come from 13C(α,n)16O followed by 14N(n,p)14C) operating at the very beginning of He-burning is the most likely for 19F production in thermal pulses."[37]
The emission and absorption spectra of fluorine contains at least eight lines or bands from the cyan to the ultraviolet.[38]
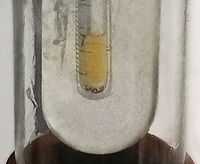
Liquid fluorine in the tube on the right is yellow-orange in color.
"Variations in sea-surface temperature (SST) occur in association with changes in the Earth's climate. [...] However, despite a large effort, the glacial record of SST is still controversial, especially in the tropics. [Studies] of foraminifera demonstrated that the interspecific variability in Mg/Ca ratios of planktonic shells is strongly correlated with water temperature at the estimated calcification depth [...] Similar correlations were also observed Sr/Ca and F/Ca [...] possibly suggesting an important role for temperature on the elemental composition of foraminifera. [...] F/Ca of foraminafera is governed primarily by biological processes."[39]
Neons

Neon has many lines across the red.
Like fluorine, neon has at least fourteen emission and absorption lines or bands from the cyan to the violet.[40]
"We analyze helium (He) and neon (Ne) isotope data sets from the southeast Pacific sector of the Southern Ocean collected in 1992 and 1994 and describe a new method to estimate glacial meltwater fluxes independent of previous approaches."[41]
Neon is a noble gas.
"21Ne exposure ages [are] of erosional glaciogenic rock surfaces on nunataks in northern Victoria Land, Antarctica: i) in the Prince Albert Mountains and ii) near Mesa Range. These nunataks are located directly at the margin of the polar plateau and therefore provide an immediate record of ice volume changes of the East Antarctic Ice Sheet, not biased by ice shelf grounding or narrow valley sections downstream the outlet glaciers. The sampling locations overlook the present ice surface by less than 200 m, but were last covered by ice 3.5 Ma BP (minimum age, not corrected for erosion). This strongly indicates that the ice sheet has not been substantially thicker than today since at least the early Pliocene, which supports the hypothesis of a stable East Antarctic Ice Sheet."[42]
Sodiums
"Glaciers in the Karakoram and western Himalaya (site 2 and 3) show high annual snow accumulation rates and high annual fluxes of calcium, sodium, chloride, sulfate, and nitrate."[43]
Magnesiums
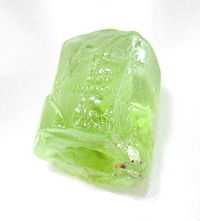
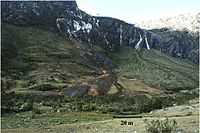
At right is a visual close up of green sand which is actually olivine crystals that have been eroded from lava rocks. Some olivine crystals are still inside the lava rock.
"Forsterite (Mg2SiO4) is the magnesium rich end-member of the olivine solid solution series."[44]
"Forsterite is associated with igneous and metamorphic rocks and has also been found in meteorites. In 2005 it was also found in cometary dust returned by the Stardust probe.[45] In 2011 it was observed as tiny crystals in the dusty clouds of gas around a forming star.[46]"[44]
"Two polymorphs of forsterite are known: wadsleyite (also orthorhombic) and ringwoodite (isometric). Both are mainly known from meteorites."[44]
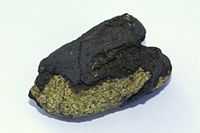
At lower right is an image of a small volcanic bomb of (black) basanite with (green) dunite.
"Dunite ... is an igneous, plutonic rock, of ultramafic composition, with coarse-grained or phaneritic texture. The mineral assemblage is greater than 90% olivine, with minor amounts of other minerals such as pyroxene, chromite and pyrope. Dunite is the olivine-rich end-member of the peridotite group of mantle-derived rocks. Dunite and other peridotite rocks are considered the major constituents of the Earth's mantle above a depth of about 400 kilometers. Dunite is rarely found within continental rocks, but where it is found, it typically occurs at the base of ophiolite sequences where slabs of mantle rock from a subduction zone have been thrust onto continental crust by obduction during continental or island arc collisions (orogeny). It is also found in alpine peridotite massifs that represent slivers of sub-continental mantle exposed during collisional orogeny. Dunite typically undergoes retrograde metamorphism in near-surface environments and is altered to serpentinite and soapstone."[47]
Magnesium (Mg I) has an absorption band at 416.727±2.9 nm with an excitation potential of 4.33 eV.[48]
Magnesium (Mg II) has an absorption band at 439.059±6.6 nm with an excitation potential of 9.96 eV.[48]
"Glaciers in the Karakoram and western Himalaya (site 2 and 3) show high annual snow accumulation rates and high annual fluxes of calcium, sodium, chloride, sulfate, and nitrate."[43]
Aluminums
"The aluminium abundance was derived from the resonance line at 394.4nm, and Al is underabundant by ∼ −0.7 dex with respect to iron."[49] "These abundances are the LTE values; no NLTE corrections, as prescribed by Baumüller and Gehren (1997) and Baumüller et al. (1998), have been applied. The prescribed NLTE corrections for Teff = 6500K, log g = 4.0, [Fe/H] = –3.0 are –0.11 ... for ... Al .... If we assume these values to apply for our lower-gravity star [CS 29497-030], then Al follows iron"[49]. The elemental abundance ratios for CS 29497-030 of aluminum are [Al/H] = -3.37, [Al/Fe] = -0.67.[49]
Both Al I absorption lines at 394.401±8.5 and 396.152±6.5 have been measured for Sirius.[48]
"As Andean glaciers recede, there has been an increase in seasonal discharge and in catchments with the least glacierized area and a decrease in total annual discharge [...] Dry season examinations, including this study, are particularly important because during this period glacial melt provides up to 40% of the total discharge in the Cordillera Blanca (Mark et al., 2005). The dry season thus provides the greatest potential opportunity to evaluate water quality deterioration related to glacial retreat. [...] In the Cordillera Blanca, the exposure of fresh sulfide-rich lithologies by retreating glaciers (Wilson et al., 1967) is thus integral to the biogeochemistry of proglacial streams. [...] the dry season geochemistry of trace and minor elements was examined in the proglacial Rio Quilcay from within 1 km of its glacier origins to 12 km downstream."[50]
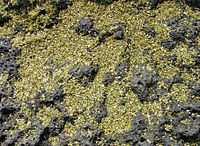
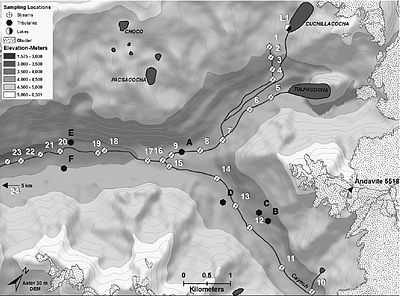
The "Rio Quilcay [is] a glacial-fed tributary to the Upper Rio Santa in the uppermost 12 km at elevations ranging from approximately 4800 to ~3800 m.a.s.l. [...] The sampled region of the Rio Quilcay receives glacial melt directly and indirectly from two proglacial lakes: Cuchillacocha and Tulpacocha. Geology in this region of the Cordillera Blanca includes pyrite schists and phyllite and pyrite-bearing quartzite intruded by a central granodiorite-tonalite batholith all overlain by clastic sediments deposited during glacial retreat (Wilson et al., 1967). Sulfide-rich lithologies are prevalent especially in the north-eastern high-altitude regions of the Cordillera Blanca (e.g. the Rio Quilcay Valley) with fresh exposures resulting from glacial scour (Wilson et al., 1967). Many headwaters in the Cordillera Blanca, including the Rio Quilcay and its tributaries, have ochreous precipitates"[50]
"Aluminum, Ca, Fe, K, Mn, Na, and Si were determined using an Optima 3000 DV Inductively Coupled Plasma-Optical Emission Spectrometer (ICP-OES) using five calibration standards that bracketed the range of concentrations within the samples, excepting the three highest samples which were diluted 1:10 before analyses. Cobalt, Cu, Ni, Pb and Zn were determined on a Perkin–Elmer Sciex Elan 6000Ⓡ Inductively Coupled Plasma-Mass Spectromenter (ICP-MS) also using five calibration standards, however with no sample dilution. All element results were drift corrected. Sulfate and NO3- were determined using a Dionex DX-120 ion chromatograph (IC). Only SO42- is reported because other anions fall near detections limits (DLs) in the higher elevation samples, or represent less than 5% of the charge balance in the pH < 4 streams."[50]
It "is likely that both the sulfide-rich lithology underlying the Rio Quilcay and the near-glacier sample locations enhanced sulfide weathering, and generated exceptionally high cation loads."[50]
"Elevated dissolved Al, Fe and Cu concentrations (6.1mg/L, 21.4 mg/L, 6.1 lg/L) were observed at site 11, 0.3 km immediately downstream of a moraine. Concentrations of these elements increased by more than four times the concentrations at site 10. Concentration gains were likely associated with glacier melt rapidly weathering minerals within the moraine (Brown, 2002)."[50]
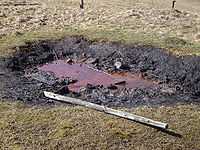
"Tributary C also influenced the chemical composition of the stream immediately below its inflow at site 13. In fact, Fe reached the second highest concentration reported (12.8 mg/L) and dissolved Al, Mn, Co, Cu, Ni and Zn concentrations also increased above their upstream values. Tributary C overlays a region with enhanced sulfide mineral oxidation [image at the right]. Evidence for this includes a major cation: SO42- equivalent ratio of 1, and abundant algal mats covered with yellow and orange precipitates (Bigham et al., 1996). In addition, dissolved Al and Zn increased an additional 270% and 160% relative to site 13–14, respectively, and after the inflow of tributary D."[50]
Silicons
Silicon (Si II) has two absorption bands at 412.805±10.8 nm and 413.088±13.0 nm with excitation potentials of 9.79 eV and 9.80 eV, respectively.[48]
Silicon has an absorption line (Si IV) at 408.9 nm.[51]
"The relatively long-lived radionuclide of silicon, 32Si, finds important applications as a tracer for studying aqueous geochemistry, biogeochemical cycles of silicon in the oceans, and the chronology of glaciers and biogenic silica-rich sediments in lacustrine and marine environments."[52]
Phosphoruses
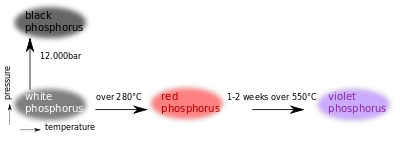
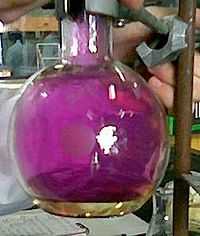
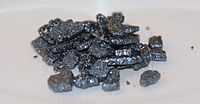
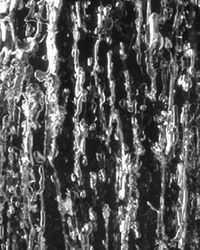
"Elemental phosphorus can exist in several allotropes; the most common of which are white and red solids. Solid violet and black allotropes are also known."[53]
"It would appear that violet phosphorus is a polymer of high relative molecular mass, which on heating breaks down into P2 molecules. On cooling, these would normally dimerize to give P4 molecules (i.e. white phosphorus) but, in vacuo, they link up again to form the polymeric violet allotrope."[53]
"Phosphorus has been shown to be deficient in glacial environments, and thus is one of the limits on microbial growth and activity."[54]
"The P species in the titania lattice should be the dominant group responsive to visible light, whereas the P species on the surface could retard the phase transition of anatase to rutile and increase the surface area and adsorption capability."[55]
"The P species in the titania lattice should be the dominant group responsive to the visible light activity, although P species on the surface could retard the phase transition of anatase to rutile, and increase the surface area and adsorption capability, consequently enhancing the photocatalytic activity."[55]
Sulfurs
"Both sulfur and oxygen isotopes of sulfate preserved in ice cores from Greenland and Antarctica have provided information on the relative sources of sulfate in the ice and their chemical transformation pathways in the atmosphere over various time periods."[56]
Chlorines
36Cl "is created by high-energy cosmic-ray neutron reactions on potassium and calcium and low energy neutron reactions on stable chlorine."[57]
"Chlorine-36 buildup dating has successfully been applied to glacial moraines in the eastern Sierra Nevada (California) and to lava flows and meteorite impact craters in the western United States."[57]
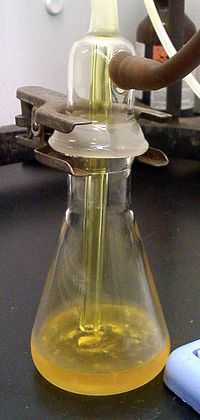
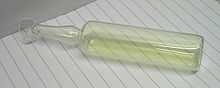
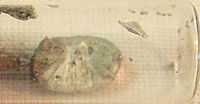
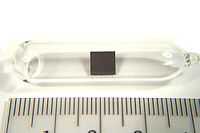
On the right is liquid chlorine (Cl2) contained in a flask for analysis. Liquid chlorine is yellow in color.
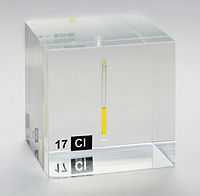
Image on the left is an ampoule containing liquid chlorine. It has been liquefied under pressure at >7.4 bar, sealed in the quartz vial (ampoule), further sealed in an "acrylic glass" (i.e., Plexiglas, Lucite) cube, cube edge length: 5 cm.
Chlorine is a "toxic, green gaseous chemical element".[58]
Argons
Argon has three emission lines that occur in an electron cyclotron resonance (ECR) heated plasmas: 497.216, 500.9334, and 506.204 nm from Ar II.[15]
Argon has an emission line occurring in the solar corona at 553.6 nm from Ar X.[59]
Argon has an emission line that occurs in an electron cyclotron resonance (ECR) heated plasmas: 473.591 nm from Ar II.[15]
Argon has several emission lines that occur in an electron cyclotron resonance (ECR) heated plasmas: 426.653, 428.29, 433.12, 434.8064, 437.075, 437.967, 442.60, and 443.019 nm from Ar II.[15]
While argon is a gas at room temperature and pressure, it becomes a solid at liquid nitrogen temperature and melts to a liquid as in the image on the right when removed from the liquid nitrogen.
Argon is a noble gas.
"Nitrogen and argon isotopes in trapped air in Greenland ice show that the Greenland Summit warmed 9 ± 3°C over a period of several decades, beginning 14,672 years ago."[60]
Potassiums
"The group [of potassium lines] at λλ 535, 510, and 495 Å "showed no trace of structure even in an arc of but half an ampere."[61]
"Potassium and calcium concentrations are high relative to other cations in glacial water, probably due to dissolution of soluble trace phases, such as carbonates, exposed by comminution, and cation leaching from biotite."[62]
Calciums
Calcium (Ca) has green emission lines at 526.170 nm and 526.556 nm as observed in solar limb faculae.[63]
As of 1977, "model calculations cannot reproduce the observed breadth of the Ca II λ3933 line in Da,F stars like Ross 627 without appealing to an unknown line-broadening mechanism".[64]
Calcium has a line occurring in the solar corona at 408.63 nm of Ca XIII.[59]
Calcium (Ca I) has two absorption bands, 422.673±4.5 nm and 430.253±0.6.[48] The second has an excitation potential of 1.89 eV.[48]
Calcium (Ca II) has an absorption band, 393.366±55.0.[48]
"Heinrich Layers are found in the North Atlantic Ocean as well-constrained markers of catastrophic iceberg surges from the Pan-Atlantic ice sheets during the last glacial cycle. Their physical and geochemical characteristics [...] are predominantly due to the source sediments of the ice-rafted debris (IRD) on the one hand (magnetic susceptibility, color, carbonate content) and the response of the palaeo-environment on the other hand (carbonate content, foraminiferal assemblage)."[65]
"Sediment cores in the Porcupine Seabight (West off Ireland) have shown the presence of Heinrich Events without the diagnostic changes in magnetic susceptibility (MS) [...] the concentration of ice-rafted debris (commonly referred to as the fraction > 150 μm) increases towards the culmination of HL2, marked by an increase in MS, [X-ray fluorescence] XRF Ca and the percentage of N. pachyderma s."[65]
The "zone where the density increases is marked by a cloud of fine and highly dense particles surrounding the IRD. [The] fine clayey “background” matrix throughout the core [consists] of zoned dolomites. [...] the mineralogical analyses [suggest] a predominant volcanic source for the magnetic susceptibility. [Both] XRF Fe and Ti show significant decreases near the HL culmination".[65]
Scandiums
Scandium (Sc II) has an absorption band, 424.683±1.0 nm, with an excitation potential of 0.31 eV.[48]
"Neutron activation analysis was used to deterimne the total [lanthanum] La and [scandium] Sc content of three soils developed from loess-capped glacial till. The profiles were classified as Gray-Brown Podzolics (Hapludalfs) overlying paleosols developed in Rockain till. The total La content in the less than 250µ fraction of these soils ranged from 18.1 to 37.1 ppm, with an average content of 23.7 ppm in the loess and 28.5 ppm in the glacial till. Total Sc in the soils ranged from 5.1 to 10.9 ppm with average contents of 6.5 and 9.0 ppm in the loess and glacial till, respectively. Translocation by pedogenic processes was indicated by the accumulation of these elements in the argillic B horizons. Correlation coefficients of La and Sc with clay percentages in the profiles were 0.79 and 0.88, respectively."[66]
Titaniums
Titanium (Ti) has green emission lines at 521.97, 522.268, 522.413, 524.729, and 526.596 nm as observed in solar limb faculae.[63]
Titanium (Ti II) has an absorption band, 391.346-441.108 nm, with an excitation potential range of 0.60-3.08 eV.[48]
Titanium has two emission lines at 456.3757 and 457.1971 nm from Ti II.[67]
"Till collected from surface exposures within the valley of the Hudson River south of the Sanford Hill magnetite-ilmenite ore deposit in the Adirondack Mountains of New York is composed primarily of plagioclase, pyroxene, garnet, magnetite, and ilmenite [FeTiO3]. The concentration of magnetite and ilmenite in bulk till both decrease exponentially with increasing distance south of the ore bodies because of dilution by the entrainment of plagioclase and garnet + pyroxene from the bedrock and from older till deposits in the valley. Evidence for comminution of magnetite and ilmenite is provided by decreasing abundances of these minerals in the coarse fractions (1000-125 µm) and corresponding increases in the fine fraction (<125 µm). The apparent rate of comminution of ilmenite as a function of transport distance is significantly greater than that of magnetite, which causes ilmenite to be concentrated in the fine fraction of till compared to magnetite."[68]
Vanadiums
"The chemistry of vanadium is noteworthy for the accessibility of the four adjacent oxidation states 2-5. In aqueous solution the colours are lilac V2+(aq), green V3+(aq), blue VO2+(aq) and, at high pH, yellow VO42-."[69]
Vanadium (V II) has an absorption band, 392.973-403.678 nm, with an excitation potential range of 1.07-1.81 eV.[48]
"The average contents of vanadium in the glacial and alluvial deposits of the Altai are comparable with those of Transbaikalia."[70]
"In Transbaikalia, elevated vanadium contents are characteristic of granitic gneisses (324 ppm), syenites (204 ppm), and granitoids (162 ppm), whereas basalts are poor in vanadium (83 ppm) [2]."[70]
"The lowest values are characteristic of glacial sandy loams and alluvial deposits."[70]
Chromiums
A chromium emission line occurs in plasmas at 520.84 nm from Cr II.[15]
Chromium (Cr) has green emission lines at 522.091, 522.407, 524.336, 524.757, and 526.572 nm as observed in solar limb faculae.[63]
Cr+ has an emission line at 524.677 nm as observed in solar limb faculae.[63]
Chromium has two emission lines at 455.8650 and 458.8199 nm from Cr II.[67]
Chromium (Cr) has emission lines that occur in plasmas at 425.435, 427.48, and 428.972 nm from Cr I.[15]
Chromium has absorption lines that occur at 425.435-428.972 nm from Cr I and 400.333-428.421 nm, 3.09-6.46 eV from Cr II near Sirius.[48]
For "the Pinchi Mine area [...] mercury ore was transported over a distance of 12 km, as measured in the clay-sized fraction (< 0.002 mm) of till, and could have been transported over 24 km according to heavy mineral concentrates (specific gravity >3.3) of this same sediment. Antimony, chromium, and nickel dispersal trains were also detected in the region."[71]
Manganeses
Manganese (Mn I) has two absorption bands at 403.449±1.4 nm and 405.554±0.8 nm, where the second has an excitation potential of 2.13 eV.[48]
Manganese (Mn II) has an absorption band at 420.638±0.8 nm with an excitation potential of 5.37 eV.[48]
"In glacial marine sediments from the St. Lawrence estuary, iron varies between 1.32 and 5.42%, manganese between 0.043 and 0.28%, and titanium between 0.31 and 0.64%."[72]
"Analyses of individual sediment size-fractions show that Fe, Mn, and Ti concentrations generally increase with decreasing grain size."[72]
Irons
"Fraunhofer's original (1817) designations of absorption lines in the solar spectrum" [include the E line for neutral iron at 526.96 nm].[73]
Iron (Fe) has green emission lines at 522.319, 522.553, 524.705, 524.911, 525.021, 525.065, 526.262, 526.288, 526.331, 526.368, 526.656, and 526.727 nm as observed in solar limb faculae.[63]
"[G]round-based observations (around the solar limb) [are] of the 530.3 nm coronal line. This green solar corona is emitted by Fe XIV ions ... Green coronal intensities (Fe XIV, 530.3 nm) obtained from different coronal stations vary greatly among themselves."[74]
Fe+ has a green emission line at 526.480 nm as observed in solar limb faculae.[63]
Iron has two emission lines occurring in the solar corona at 637.451 nm from Fe X and 705.962 nm from Fe XV.[59]
Iron has a line occurring in the solar corona in the violet at 398.69 nm of Fe XI.[59]
Iron (Fe I) has an absorption band at 392.291-440.475 nm with an excitation potential range of 0.05-2.46 eV.[48]
Iron (Fe II) has an absorption band at 393.829-438.538 nm with an excitation potential range of 1.66-2.77 eV.[48]
Iron (Fe II) has an emission line at 489.1 nm.[75]
The Fraunhofer G line at 430.790 nm is from iron.[76]
"Dissolved iron (DFe) and total dissolvable Fe (TDFe) were measured in January–February 2009 in Pine Island Bay, as well as in the Pine Island and Amundsen polynyas (Amundsen Sea, Southern Ocean). Iron (Fe) has been shown to be a limiting nutrient for phytoplankton growth, even in the productive continental shelves surrounding the Antarctic continent."[77]
"At the southern end of Pine Island Bay, the [Circumpolar Deep Water] CDW upwelled under the Pine Island Glacier, bringing nutrients (including Fe) to the surface and melting the base of the glacier."[77]
"The largest source was Fe input from the PIG, which could satisfy the total Fe demand by the phytoplankton bloom by lateral advection of Fe over a range of 150 km from the glacier."[77]
"Total-Fe (TFe) and total-P (TP) concentrations are high in all three glacial streams, but the ratios of soluble reactive phosphate (SRP) to TP are very different. The Upper Manso Stream that drains the Manso Glacier has relatively low SRP (0.01-0.23 PM), representing a small fraction of its TP (O. l-5%). The SRP of the two streams draining smaller side glaciers (0.12-0.69 PM) represents a much larger portion of their TP (20-32%)."[78]
"TFe, dissolved sulfate, and δ 34S data suggest that pyrite oxidation is the most likely weathering reaction contributing sulfate to the Upper Manso Stream but not to the two smaller glacial-fed streams, in which atmospheric inputs can account for all of the sulfate."[78]
Cobalts
"On glacier surfaces conditions [...] exist for aerosols and airborne dust deposited with anthropogenic and natural radionuclides attached on their surfaces. In the course of agglomeration processes initiated by melting and redistribution, these particles may concentrate in small depressions, ice pockets, ablation edges etc. and form substances called cryoconites ('ice dust'). As there is no other matrix than the original aerosol particles, cryoconites are a sink for radionuclides and airborne pollutants and their activity levels are among the highest produced by natural processes observed in environmental media. 137Cs activities found on glaciers in the Austrian alps are between 255 and 136.000 Bq/kg and predominantly derived from Chernobyl, but also from global fallout. Further anthropogenic radionuclides detected are 134Cs, 90Sr, 238,239+240Pu, 241Am, 125Sb, 154Eu, 60Co and 207Bi [in] combination with the naturally occurring radionuclides 7Be and 210Pb and isotopic ratios such as 134Cs/137Cs".[79]
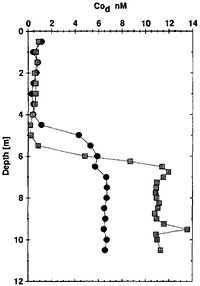
The "concentration of dissolved Mn and Co [figure at the right] increase sharply across the oxic/anoxic transition, from 5 to 5.5 m depth. The concentration of Co rises from detection limit, when O2 is still present, to 6.8 nM and 12 nM, respectively, for May 1994 and July-August 1995."[80]
In the oxic mixolimnion, dissolved Co remains primarily under its free hydrated form (Co[H2]2+6, whereas in the anoxic bottom waters it seems to be primarily present as a sulfide complex (CoS0).
Nickels
Nickel has an emission line occurring in the solar corona at 511.603 nm from Ni XIII.[59]
Nickel has an emission line occurring in the solar corona at 670.183 nm from Ni XV.[59]
Nickel has three emission lines occurring in the solar corona at 380.08 nm of Ni XIII and 423.14 nm and 431.1 of Ni XII.[59]
Nickel has an absorption band at 401.550-436.210 nm with an excitation potential of 4.01 eV.[48]
In "the Arctic Archipelago and in parts of northern Baffin Island and Boothia Peninsula the glaciers were apparently cold-based and effected little erosion of the preglacial landscape."[81]
Nickel "occurs in concentrations far above the crustal average in basic and ultrabasic igneous rocks. Where a glacier has eroded nickel-enriched zones in basalts, gabbros, serpentinized periodotites, and similar basic or ultrabasic igneous rocks, or their metamorphic equivalents, nickel-enriched glacial debris may be spread out in the form of a glacial dispersal train."[81]
"Nickel occurs in unweathered glacial sediments in the same mineral phases as those in which it is found in rocks."[81]
"Where a glacier has overridden ultrabasic rocks, nickel may still be present in sulfide grains, but its presence in silicates such as olivine, serpentine, amphiboles, biotite, and talc, can lead to very high bulk nickel compositions in till or derived sediments."[81]
Coppers
"Approximately five million tonnes were mined from native copper deposits in Michigan. Copper masses from the Michigan deposits were transported by the Pleistocene glaciers. Areas on the copper surfaces which appear to represent glacial abrasion show minimal corrosion."[82]
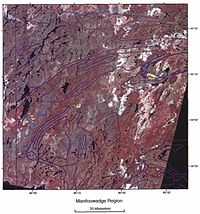
"A group of pixel areas north of Lake Superior [in the Landsat image on the right] take the form of a linear band which lies along the northern edge of the Port Coldwell Complex (D). [...] there are numerous Cu showings along the northern edge of the Port Coldwell complex (Ontario Division of Mines, 1971)."[83]
Zincs
"Satellite images taken over the past several decades show the dramatic disappearance of ice, including on the island’s inland areas, where the ice fields can in places be up to three and a half kilometers deep."[84]
"Along with uranium, zinc, iron ore, copper and gold, Greenland’s ancient rocks also harbor large quantities of those minerals known as “rare earth,” among them lanthanum, cerium, neodymium, praesodymium, terbium and yttrium."[84]
Galliums
The image on the right is a drop of liquid gallium.
Gallium "enrichments are observed in the deep waters of the Norwegian Sea and Iceland Basin."[85]
"If northern deep water formation occurs at lower latitudes during glacial periods, the amount of sediment resuspension in the formation areas is likely to be affected with concomitant effects on the trace element content of newly formed northern-source deep waters."[85]
"At higher growth temperatures(>600'C) the lifetimes of the alkyl-gallium species are much shorter and the growth front dynamics should begin to look more like MBE since atomic gallium will be the dominant group III surface species."[86]
Germaniums
"Data from three glacial meltwater streams draining Mt. Tronador in the southern Argentine Andes (72°W, 41°S) show that subglacial pyrite oxidation and the subsequent precipitation of iron oxides strongly influence dissolved phosphate concentrations but do not appear to affect dissolved germanium concentrations."[78]
"Dissolved Ge appears to show no preferential sorption relative to dissolved silica, in contrast to the speculation that Ge preferentially sorbs on fresh iron hydroxyoxide surfaces."[78]
"Since the energy of the 3.11 MeV peak observed here coincides with that of the dominant group in the delayed proton spectrum of Ca, it has been necessary to evaluate the possibility that Ca, produced in reactions on the small oxygen contamination in the target, could be the source of this activity"[87] This is with respect to beta-delayed proton decay of 61Ge.[87]
Arsenics
"The dominant group V source is arsenic, although antimony and phosphorous sources are not atypical."[88]
Bromines
Bromine is a halogen that is a liquid at room temperature and pressure.
"Br and Pb were more evenly distributed over the various food groups; the group 'nuts' showed the highest content of Br (about 8 mg/kg), but for Pb such a dominant group could not be indicated."[89]
Kryptons
Krypton is a noble gas.
Rubidiums
"Rubidium [occurs] in the mineral lepidolite [and is found] through the use of a spectroscope ... Because of the bright red lines in its emission spectrum".[90]
Strontiums
Strontium (Sr II) has two absorption bands: 407.771±11.3 nm and 421.552±10.4 nm.[48]
Yttriums
Yttrium (Y II) has an absorption band from 395.035 to 439.802 nm, with an excitation potential range of 0.10-0.13 eV.[48]
Zirconiums
"Zirconium isotopic abundances [may be] determined from ZrO bandheads near 6925 Å via synthetic spectra for a sample of S stars."[91]
Zirconium (Zr II) has an absorption band, 395.824-415.624 nm, with an excitation potential of 0.52-0.75 eV.[48]
Technetiums
 and
and

These "reactions probe precisely the time scale and neutrino-flux component of most interest: the boron-8 neutrino luminosity, which is the most sensitive monitor of variations in the solar core temperature, during and before the Pleistocene epoch. (The half-lives of technetium-97 and -98 are, respectively, 2.6 and 4.2 million years; the reaction on molybdenum-98 is induced only by the high-energy boron-8 neutrinos; and the reaction on molybdenum-97 may sample in addition the flux of beryllium-7 neutrinos, which are second only to boron-8 neutrinos in sensitivity to the core temperature.)"[21]
Iodines
Subject to atmospheric pressure and temperature, iodine can be gaseous, liquid, or solid.
Xenons
Xenon is a "heavy, gaseous chemical element ... of the noble gases group".[92]
Mercurys

"The green mercury line λ 5461 appears to be quite unique in the possession of its satellites."[61]
There are "telluric mercury lines".[93]
There are an additional pair of lines for mercury, one at 496.03 nm in the green and the second at 491.6 nm in the cyan.[94]
As the spectrum of mercury (Hg) indicates, it has lines in the violet.
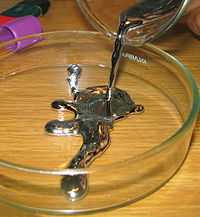
The metallic element mercury is a liquid at room temperature and pressure as shown in the image on the right.
Def. a naturally occurring, silvery-colored, metallic liquid, composed primarily of the chemical element mercury, is called mercury, or native mercury.
"Abundant cinnabar (HgS) mineralization is associated with the Pinchi Fault in central British Columbia. [...] The mercury content of till (a sediment type directly deposited by glaciers) in the area of this fault is primarily controlled by the occurrence of cinnabar mineralization in bedrock an the direction of ice flow. Cinnabar-bearing bedrock was eroded by glaciers, transported in the direction of ice flow, and deposited "down-ice" from its source."[71]
Thalliums
There is a green thallium line that shows up in arc spectra using "two to eight amperes at 120 volts, usually between ordinary arc carbons."[61]
Radons
Radon is "one of the noble gases."[95]
Thoriums

Def. "a chemical element (symbol Th) with atomic number 90"[96] is called thorium.
Thorium is a silvery, radioactive, metallic element. At room temperature and pressure, thorium crystallizes into a face-centered cubic lattice, where one thorium atom occupies each location of a black sphere in the diagram on the left.
Ions
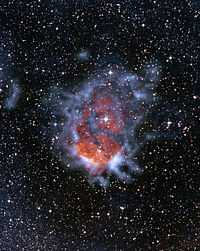
The image at right is a colour "composite image of RCW120. It reveals how an expanding bubble of ionised gas about ten light-years across is causing the surrounding material to collapse into dense clumps where new stars are then formed. The 870-micron submillimetre-wavelength data were taken with the LABOCA camera on the 12-m Atacama Pathfinder Experiment (APEX) telescope. Here, the submillimetre emission is shown as the blue clouds surrounding the reddish glow of the ionised gas (shown with data from the SuperCosmos H-alpha survey). The image also contains data from the Second Generation Digitized Sky Survey (I-band shown in blue, R-band shown in red)."[97]
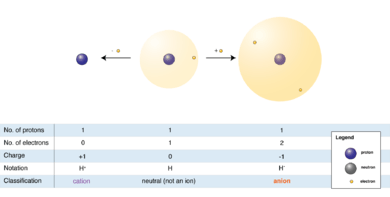
"An ion is an atom or molecule in which the total number of electrons is not equal to the total number of protons, giving it a net positive or negative electrical charge."[98]
The hydrogen anion (shown in the diagram at right), with its loosely held two-electron cloud, has a larger radius than the neutral atom, which in turn is much larger than the bare proton of the cation. Hydrogen forms the only cation that has no electrons, but even cations that (unlike hydrogen) retain one or more electrons, are smaller than the neutral atoms or molecules from which they are derived.
"In the second dominant group of ions we generally see more discrepancies in the model and the HIS data".[99]
Nitrates
Nitrate (NO3-) concentrations in the [glacial and snowpack meltwaters] GSF lakes were 1-2 orders of magnitude higher than in [snowpack melt] SF lakes. Although nitrogen (N) limitation is common in alpine lakes, algal biomass was lower in highly N-enriched GSF lakes than in the N-poor SF lakes."[100]
Molecules
"Using the Submillimeter Array, a set of eight radiotelescopes atop Mauna Kea in Hawaii, [it was] found that G0.253+0.016 possesses very few ultra-dense nuggets that could collapse to form stars."[101]
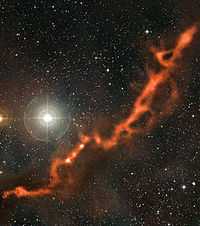
"This image [at right] from the APEX telescope, of part of the Taurus Molecular Cloud, shows a sinuous filament of cosmic dust more than ten light-years long. In it, newborn stars are hidden, and dense clouds of gas are on the verge of collapsing to form yet more stars. The cosmic dust grains are so cold that observations at submillimetre wavelengths, such as these made by the LABOCA camera on APEX, are needed to detect their faint glow. This image shows two regions in the cloud: the upper-right part of the filament shown here is Barnard 211, while the lower-left part is Barnard 213."[102]
"The submillimetre-wavelength observations from the LABOCA camera on APEX, which reveal the heat glow of the cosmic dust grains, are shown here in orange tones. They are superimposed on a visible-light image of the region, which shows the rich background of stars. The bright star above the filament is φ Tauri."[102]
"The ω-hydroxymonocarboxylates represented the dominant group with a contribution higher than one quarter of the total."[103]
Iron hydride
"Carroll and McCormack (1972) in Dublin reported complex spectra in the blue and green wavelength regions of both FeH and FeD".[57]
"Carroll et al. (1976) detected a number of coincidences between laboratory lines of FeH and weak unidentified solar lines, again in the blue and green wavelength region, in addition to the infrared."[104]
Cyanides
"The CN radical through emission in its Violet system bands has a long-established presence in comets."[105]
Acids
Notation: let the symbol HA stand for humic acid.
"HAs have been the main object of study in the investigated soils primarily because, from an ecological point of view, this is the most stable, though not always dominant group of substances."[106]
"An organic acid is an organic compound with acidic properties. The most common organic acids are the carboxylic acids, whose acidity is associated with their carboxyl group –COOH."[107]
"That good correlation can be obtained if one focuses attention on the dominant group can be nicely illustrated with the benzoic acids."[108]
Compounds
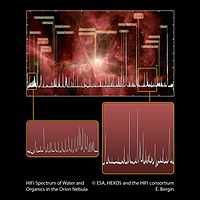
"The HIFI spectrum of the Orion Nebula, superimposed on a Spitzer image of Orion. A characteristic feature is the spectral richness: among the organic molecules identified in this spectrum are water, carbon monoxide, formaldehyde, methanol, dimethyl ether, hydrogen cyanide, sulfur oxide, sulfur dioxide and their isotope analogues. It is expected that new molecules will also be identified. This spectrum is the first glimpse at the spectral richness of regions of star and planet formation. It harbors the promise of a deep understanding of the chemistry of space once the complete spectral surveys are available."[109]
"This HIFI spectrum was obtained for the Herschel HEXOS Key Program - a scientific investigation using the Herschel HIFI and PACS instruments to perform full line surveys of five sources in the Orion and Sagittarius B2 molecular clouds."[109]
Oxidanes

"Hill Formula: H2O. Molecular Weight: 18.02 g/mol. CAS registry number(s): 7732-18-5. Substance name(s): water; Wasser; Wasserstoffoxid; Eis; Wasserdampf; Oxidane; R 718; R-718; Ice; Wasser."[110]
"The major atmospheric gases on Earth, Venus, and Mars were probably CO2, H2O, and N2. [The ions from the upper parts of an atmosphere] are often suprathermal, and their interactions can produce suprathermal neutral atoms as well [The] ionopause [...] separates the bound ionosphere from an outer region in which the solar wind is diverted and flows around and past the planet. This region still contains some neutral gas, and if such atoms are ionized by solar photons or electron impact, they are swept up in the flow."[111]
"Isotopic exchange between ice and water is found to take place in temperate glaciers. This exchange causes homogenization of deuterium in snow during summer thaws, together with a general increase in deuterium concentration."[112]
"Oxygen-isotope analyses of ice and firn from the Saskatchewan Glacier, Canada, and the Malaspina Glacier, Alaska, show that variations in ratios are likely to be of considerable value in glaciological research."[36]
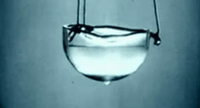
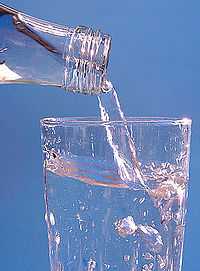
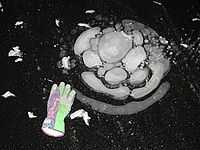
The image on the right demonstrates that this substance's constituent parts are sticking together but not crystallizing as it flows from a bottle into a glass.
Def. a clear liquid having the chemical formula H2O, required by all forms of life on Earth is called water.
Def. of water from the metadefinition of a clear liquid:
- a clear flowing substance
- keeping or retaining no shape or definite shape
- a. except that determined by the containing receptacle
- 3. composed of H2O molecules
- a. not tending to separate from one another like those of a gas
- b. readily changing relative position
is called water.
In the image on the right impact from a water drop to contained but open water causes an upward "rebound" jet surrounded by circular capillary waves.
Hydrogen fluoride
"[T]he detection of absorption by interstellar hydrogen fluoride (HF) [in the submillimeter band occurs] along the sight line to the submillimeter continuum sources W49N and W51."[113]
"[T]he 1232.4762 GHz J = 1-0 HF transition [has been observed] in the upper sideband of the band 5a receiver."[113]
"HF is the dominant reservoir of fluorine wherever the interstellar H2/atomic H ratio exceeds ~ 1; the unusual behavior of fluorine is explained by its unique thermochemistry, F being the only atom in the periodic table that can react exothermically with H2 to form a hydride."[113]
The observations "toward W49N and W51 [occurred] on 2010 March 22 ... The observations were carried out at three different local oscillator (LO) tunings in order to securely identify the HF line toward both sight lines. The dual beam switch mode (DBS) was used with a reference position located 3' on either side of the source position along an East-West axis. We centered the telescope beam at α =19h10m13.2s, δ = 09°06'12.0" for W49N and α = 19h23m43.9s, δ = 14°30'30.5" for W51 (J2000.0). The total on-source integration time amounts to 222s on each source using the Wide Band Spectrometer (WBS) that offers a spectral resolution of 1.1 MHz (~0.3 km s-1 at 1232 GHz)."[113]
Hydrogen chloride
"[T]he first detection of chloronium, H2Cl+, in the interstellar medium, [occurred on March 1 and March 23, 2010,] using the HIFI instrument aboard the Herschel Space Observatory. The 212 − 101 lines of ortho-H235Cl+ and ortho-H237Cl+ are detected in absorption towards NGC 6334I, and the 111 − 000 transition of para-H235Cl+ is detected in absorption towards NGC 6334I and Sgr B2(S)."[114]
Carbon monoxide
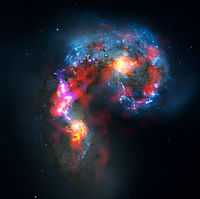
"The Antennae Galaxies (also known as NGC 4038 and 4039) are a pair of distorted colliding spiral galaxies about 70 million light-years away, in the constellation of Corvus (The Crow). This view combines ALMA observations, made in two different wavelength ranges during the observatory’s early testing phase, with visible-light observations from the NASA/ESA Hubble Space Telescope."[115]
"The Hubble image is the sharpest view of this object ever taken and serves as the ultimate benchmark in terms of resolution. ALMA observes at much longer wavelengths which makes it much harder to obtain comparably sharp images. However, when the full ALMA array is completed its vision will be up to ten times sharper than Hubble."[115]
"Most of the ALMA test observations used to create this image were made using only twelve antennas working together — far fewer than will be used for the first science observations — and much closer together as well. Both of these factors make the new image just a taster of what is to come. As the observatory grows, the sharpness, speed, and quality of its observations will increase dramatically as more antennas become available and the array grows in size. This is nevertheless the best submillimetre-wavelength image ever taken of the Antennae Galaxies and opens a new window on the submillimetre Universe."[115]
"While visible light — shown here mainly in blue — reveals the newborn stars in the galaxies, ALMA’s view shows us something that cannot be seen at those wavelengths: the clouds of dense cold gas from which new stars form. The ALMA observations — shown here in red, pink and yellow — were made at specific wavelengths of millimetre and submillimetre light (ALMA bands 3 and 7), tuned to detect carbon monoxide molecules in the otherwise invisible hydrogen clouds, where new stars are forming."[115]
"Massive concentrations of gas are found not only in the hearts of the two galaxies but also in the chaotic region where they are colliding. Here, the total amount of gas is billions of times the mass of the Sun — a rich reservoir of material for future generations of stars."[115]
Zinc selenides
"ZnSe appears as an attractive material to blue and near UV optoelectronics."[116]
Inorganics
Def. any chemical "not containing carbon atoms"[117] or "containing carbon atoms ionically bound to other atoms"[117] is called an inorganic, or inorganic compound, or inorganic others by analogy.
Usage notes
- "By convention they also include the carbides, carbonates, carbon monoxide and carbon dioxide; carbon disulphide is debatable".[117]
"The behavior of both moieties could be successfully described by the L component of the TLS analysis, with the T and S components having negligible magnitudes, indicating that libration about the central atom was the dominant group motion for both species."[118]
"The sterically dominant group in the O,NTf chiral ligand is the SO 2 moiety, as one oxygen protrudes into the open quadrant created by one of the back pointing pseudoaxial P-phenyl substituents."[119]
"Both of the emission spectra present the characteristic emission bands originating from the transition 5D4 → 7FJ (J=6, 5, 4, 3), with the transition 5D4 → 7F5 green emission as the dominant group.[120]
Organics
Notation: let the symbol PE stand for polyethylene.
"Finally, there is a dominant group (PE) that is still growing on the market."[121]
"Phosphomonoesters are the dominant group of organic phosphorus compounds in most soils and comprise 16%–55% of total soil P."[122]
"In sediments, total PCT concentrations expressed as A5442 equivalents ranged from 22 to 100 μg/kg of wet weight, with hepta-CTs as the dominant group of congeners."[123]
"The four model compounds selected represent pyridinic and CN nitrogen groups, pyridinic nitrogen because this group has been observed to be a dominant group and CN because of the indirect observation of HCN formation."[124]
"In contrast, with hydrogen as the primary electron donor, homoacetogens became the dominant group in hydrogen utilization with their advantageous kinetic properties."[125]
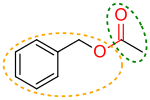
"[T]he dominant group is the same in each case and the subsidiary group is changed only by the substitution of acetyl for methyl at the oxygen atom."[126]
"It appears to us that the only interpretation that can be placed upon the facts as they are now known to us is that the acceptor is a radicle which is very closely allied to, if not identical with, a dominant group in the hydrolyte."[127]
"Volatile organic compounds (VOCs) are organic chemicals that have a high vapor pressure at ordinary, room-temperature conditions. Their high vapor pressure results from a low boiling point, which causes large numbers of molecules to evaporate or sublimate from the liquid or solid form of the compound and enter the surrounding air."[128]
Methanes
The diagram at the right describes how methane (CH4) leaks from sea beds.
"Methane is far more powerful in trapping heat, but only lasts about a decade before it dissipates into carbon dioxide and other chemicals. Carbon dioxide traps heat for about a century."[129]
"Most of the yedoma is in little-studied areas of northern and eastern Siberia. What makes that permafrost special is that much of it lies under lakes; the carbon below gets released as methane. Carbon beneath dry permafrost is released as carbon dioxide."[129]
"The big methane or carbon dioxide release hasn’t started yet, but it’s coming."[130]
"Methane trapped in a special type of permafrost [in the image at the right] is bubbling up at rate five times faster than originally measured [...]."[131]
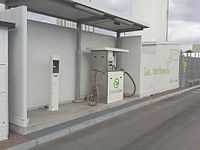
"Care for the environment is becoming more and more of an issue in business today, also in the transport sector and liquid methane gas is a good alternative for diesel fuel."[132]
"Liquid methane gas and diesel fuel are used in combination. When the liquid methane gas and the diesel fuel are mixed in a proportion of 75-25 a truck can run 500 to 1000 km. depending on the driving circumstances."[132]
"The use of the liquid gas depends on economies that are made by using it. The gas is cheaper. One kilo (liquid methane is expressed in kilos) costs less than one litre of diesel and contains 35% more energy. A truck running on it, is far more expensive though. A normal truck costs 100.000 Euro, a truck running on liquid gas, 35.000 Euro more. And also the refuelling possibilities are restricted. Some more facilities are planned though."[132]
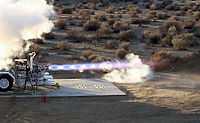
"Rocket engines aren't exactly synonymous with liquid methane, but NASA's latest project shows just what this natural gas is capable of -- produces 7,500-pound thrust in this case. Best of all, "you don't have to put on a HAZMAT suit to handle it like fuels used on many space vehicles.""[133]
Alcohols

Def. any "of a class of organic compounds (such as ethanol) containing a hydroxyl functional group (-OH)"[134] is called an alcohol.
"As such alcohols became the dominant group of volatiles in the overripe mango, the relative concentrations of other groups of compounds were, of course, correspondingly reduced."[135]
Ethanols
Def. of ethanol from the metadefinition of a clear liquid:
- a clear flowing substance
- keeping or retaining no shape or definite shape
- a. except that determined by the containing receptacle
- 3. composed of C2H5OH molecules
- a. not tending to separate from one another like those of a gas
- b. readily changing relative position
is called ethanol.
Functional groups
"Various oxygen functionalities include carboxyl (−COOH), the dominant group, and phenolic and/or enolic −OH, alcoholic −OH, and carbonyl (−CO)."[136]
"In organic chemistry, functional groups are specific groups of atoms within molecules that are responsible for the characteristic chemical reactions of those molecules. The same functional group will undergo the same or similar chemical reaction(s) regardless of the size of the molecule it is a part of.[137] However, its relative reactivity can be modified by nearby functional groups."[138] "In diffuse clouds the dominant group appears to be -CH3."[139]
Bio-organics
Neurochemicals include "transmitters, peptides, proteins, lipids, sugars, and nucleic acids".[5]
Fatty acids
"Overall, polyunsaturated fatty acids were the dominant group of fatty acids (Table 2), except at Station 6 where saturated fatty acids also dominated the fatty acid pool."[140]
Dopamine-β-Hydroxylases
"Plasma levels of activity in the autosomal dominant group (1700 ± 90 U) were higher than those in the control (850 ± 60 U) or the autosomal recessive group (660 ± 70 U) (p less than 0.001)."[141]
Anthocyanins
"According to their composition, the Japanese cultivars can be categorized into two groups on the basis of the shade of color and the peonidin/cyanidin (pn/cy) ratio: cyanidin types (pn/cy < 1.0) with a greater degree of blueness (blue dominant group) and peonidin types (pn/cy > 1.0) with a greater degree of redness (red dominant group) (9, 16)."[142]
"On the basis of the calculated peonidin/cyanidin ratio (0.10) this cultivar belongs to the blue dominant group (“cyanidin-type”)."[142]
Iodopsins
"Iodopsins ... are the photoreceptor proteins found in the cone cells of the [human] retina that are the basis of color vision. Iodopsins are very close analogs of the visual purple rhodopsin [R] that is used in night vision. Iodopsins consist of a protein called photopsin and a bound chromophore, retinal. "[143]
"In humans there are three different iodopsins (rhodopsin analogs) that form the protein-pigment complexes photopsin I, II, and III. They are called erythrolabe, chlorolabe, and cyanolabe, respectively.[144] These photopsins have absorption maxima for yellowish-green (photopsin I), green (photopsin II), and bluish-violet light (photopsin III)."[143]
Alloys
"The broad, 60 < FWHM < 100 nm, featureless luminescence band known as extended red emission (ERE) is seen in such diverse dusty astrophysical environments as reflection nebulae17, planetary nebulae3, HII regions (Orion)12, a Nova11, Galactic cirrus14, a dark nebula7, Galaxies8,6 and the diffuse interstellar medium (ISM)4. The band is confined between 540-950 nm, but the wavelength of peak emission varies from environment to environment, even within a given object. ... the wavelength of peak emission is longer and the efficiency of the luminescence is lower, the harder and denser the illuminating radiation field is13. These general characteristics of ERE constrain the photoluminescence (PL) band and efficiency for laboratory analysis of dust analog materials."[145]
"The PL efficiencies measured for HAC and Si-HAC alloys are consistent with dust estimates for reflection nebulae and planetary nebulae, but exhibit substantial photoluminescence below 540 nm which is not observed in astrophysical environments."[145]
"Optical constants measured at normal incidence for iron (Bolotin et al., 1969) and for iron-nickel alloys (Sasovskaya and Noskov, 1974) also predict a red-sloped spectrum."[146]
"Grain size varies from 98 to 530 lm with an average of *150 lm. Minor [elements] oxidation [from an iron–nickel–chromium–cobalt–phosphorus alloy] is evidenced by the presence of a light brown and blue surface layer composed of very fine-grained (<1 lm) crystals on the surface."[45] "[T]he oxidation of minor elements in metallic alloys in the early solar system" is indicated to possess at instances a blue surface layer.[45]
Mineraloids
Def. "[a] substance that resembles a mineral but does not exhibit crystallinity"[147] is called a mineraloid.
Petroleums
Def. a "flammable liquid ranging in color from clear to very dark brown and black, consisting mainly of hydrocarbons, occurring naturally in deposits under the Earth's surface"[148] is called a petroleum.
Minerals
"A mineral is a naturally occurring homogeneous solid, inorganically formed, with a definite chemical composition and an ordered atomic arrangement. Ice is naturally occurring, given a temperature below 0 degrees Celsius (32 degrees Fahrenheit). It is homogenous (of one material), formed inorganically, and has an ordered atomic structure. Ice has a definite chemical composition (H20), with hydrogen and oxygen atoms bonding in a specific manner."[149]
Materials
.jpg)
"Calculations were made using the wavelength-dependent complex refractive indices of silicate (Draine 1985), glassy carbon (Edoh 1983), and Tholin (Khare et al. 1984). [...] these materials were chosen as broadly representative of the types of matter thought to be present in comet dust."[150]
"Observations using the Atacama Large Millimeter/submillimeter Array (ALMA) have revealed an unexpected spiral structure in the material around the old star R Sculptoris. This feature has never been seen before and is probably caused by a hidden companion star orbiting the star. This slice through the new ALMA data reveals the shell around the star, which shows up as the outer circular ring, as well as a very clear spiral structure in the inner material."[151] The image band is centered at 870 µm.
Def. "an advanced form of new ice that forms as a stable sheet with a smooth bottom surface"[149] is called congelation ice.
At the right is a "photograph in natural light of the vertically oriented pores in congelation ice."[149]
Shelters
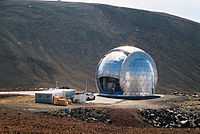
The image at right shows the protective dome or shelter for the Caltech Submillimeter Observatory at the Mauna Kea Observatory.
See also
References
- ↑ "chemistry, In: Wiktionary". San Francisco, California: Wikimedia Foundation, Inc. May 13, 2012. Retrieved 2012-07-12.
- ↑ Philip B. Gove, ed (1963). Webster's Seventh New Collegiate Dictionary. Springfield, Massachusetts: G. & C. Merriam Company. pp. 1221.
- ↑ "What is Chemistry?". Chemweb.ucc.ie. Retrieved 2011-06-12.
- ↑ Chemistry. (n.d.). Merriam-Webster's Medical Dictionary. Retrieved August 19, 2007.
- 1 2 "Chemistry, In: Wikipedia". San Francisco, California: Wikimedia Foundation, Inc. June 27, 2012. Retrieved 2012-07-15.
- ↑ "chemical, In: Wiktionary". San Francisco, California: Wikimedia Foundation, Inc. 9 March 2015. Retrieved 2015-07-16.
- 1 2 3 "Hydrogen spectral series, In: Wikipedia". San Francisco, California: Wikimedia Foundation, Inc. May 2, 2012. Retrieved 2012-05-14.
- ↑ "The Hydrogen 21-cm Line". Hyperphysics. Georgia State University. 2004-10-30. Retrieved 2009-03-18.
- ↑ Richard L. Liboff (2002). Introductory Quantum Mechanics. Addison-Wesley. ISBN 0-8053-8714-5.
- ↑ Niels Bohr (1985), "Rydberg's discovery of the spectral laws", in J. Kalckar, N. Bohr: Collected Works, 10, North-Holland Publ.
- ↑ "Balmer series, In: Wikipedia". San Francisco, California: Wikimedia Foundation, Inc. February 2, 2012. Retrieved 2012-07-11.
- ↑ "Filters". Astro-Tom.com. Retrieved 2006-12-09.
- ↑ D. B. Murphy, K. R. Spring, M. J. Parry-Hill, I. D. Johnson, M. W. Davidson. "Interference Filters". Olympus. Retrieved 2006-12-09.
- ↑ "H-alpha, In: Wikipedia". San Francisco, California: Wikimedia Foundation, Inc. December 30, 2011. Retrieved 2012-07-11.
- 1 2 3 4 5 6 7 8 9 10 11 12 K. J. McCarthy, A. Baciero, B. Zurro, and TJ-II Team (June 12-16 2000). Impurity Behaviour Studies in the TJ-II Stellarator, In: 27th EPS Conference on Contr. Fusion and Plasma Phys.. 24B. Budapest: ECA. pp. 1244-7. http://crpppc42.epfl.ch/Buda/pdf/p3_116.pdf. Retrieved 2013-01-20.
- ↑ E. C. C. Baly (October 6, 1898). "Helium in the Atmosphere". Nature 58 (1510): 545. doi:10.1038/058545a0.
- ↑ "helium, In: Wiktionary". San Francisco, California: Wikimedia Foundation, Inc. October 1, 2013. Retrieved 2013-10-05.
- ↑ Jeremy R. King, Constantine P. Deliyannis, and Merchant Boesgaard (April 1, 1997). "The 9Be Abundances of α Centauri A and B and the Sun: Implications for Stellar Evolution and Mixing". The Astrophysical Journal 478 (2): 778. http://iopscience.iop.org/0004-637X/478/2/778/pdf/0004-637X_478_2_778.pdf. Retrieved 2012-07-11.
- ↑ Jasper Kirkby (November 01, 2007). "Cosmic rays and climate". Surveys in Geophysics 28 (5-6): 333-75. doi:10.1007/s10712-008-9030-6. http://arxiv.org/pdf/0804.1938.pdf. Retrieved 2014-09-19.
- ↑ P Sielicki, H Janik, A Guzman (2012). "Grain type and size of particulate matter from diesel vehicle exhausts analysed by transmission electron microscopy". Environmental Technology 33 (15). doi:10.1080/09593330.2011.646315. http://www.tandfonline.com/doi/abs/10.1080/09593330.2011.646315. Retrieved 2013-08-29.
- 1 2 George A. Cowan and Wick C. Haxton (Summer 1982). "Solar Variability Glacial Epochs, and Solar Neutrinos". Los Alamos Science 4 (2): 47-57. http://fas.org/sgp/othergov/doe/lanl/lib-www/pubs/00416654.pdf. Retrieved 2014-09-23.
- ↑ Abhijlt Sanyal, N. G. Hemming, Gilbert N. Hanson & Wallace S. Broecker (19 January 1995). "Evidence for a higher pH in the glacial ocean from boron isotopes in foraminifera". Nature 373: 234-6. http://www.pmc.ucsc.edu/~apaytan/290A_Winter2014/pdfs/B%20isotopes%20Jn%2024-1.pdf. Retrieved 2014-09-20.
- ↑ Mario Affatigato, Steve Feller, Allison K Schue, Sarah Blair, Dale Stentz, Garret B Smith, Dan Liss, Matt J Kelley, Cole Goater and Raghuvir Leelesagar (August 13, 2003). "Studies of oxide glass structure using laser ionization time of flight mass spectrometry". Journal of Physics: Condensed Matter 15 (31): 2323-34. http://iopscience.iop.org/0953-8984/15/31/308. Retrieved 2013-08-29.
- ↑ Anita L. Cochran, W. W. Jackson (September 2006). "What is the Parent of Cometary O (1S)?". Bulletin of the American Astronomical Society 38: 516.
- ↑ V. E. Villafañe, E. W. Helbling, O. Holm-Hansen (October 1995). "Spatial and temporal variability of phytoplankton biomass and taxonomic composition around Elephant Island, Antarctica, during the summers of 1990–1993". Marine Biology 123 (4): 677-86. doi:10.1007/BF00349110. http://link.springer.com/article/10.1007/BF00349110. Retrieved 2013-08-29.
- ↑ "nitrogen, In: Wiktionary". San Francisco, California: Wikimedia Foundation, Inc. September 22, 2013. Retrieved 2013-10-05.
- ↑ R. J. Thomas and R. A. Young (January 1981). "Measurement of atomic oxygen and related airglows in the lower thermosphere". Journal of Geophysical Research: Oceans 86 (08): 7389-93. doi:10.1029/JC086iC08p07389. http://onlinelibrary.wiley.com/doi/10.1029/JC086iC08p07389/abstract. Retrieved 2013-01-16.
- ↑ A. S. Wilson, J. A. Braatz, T. M. Heckman, J. H. Krolik, and G. K. Miley (December 20, 1993). "The Ionization Cones in the Seyfert Galaxy NGC 5728". The Astrophysical Journal Letters 419 (12): L61-4. doi:10.1086/187137.
- 1 2 J. C. McLennan, G. M. Shrum (1925). [on#related-urlshttp://rspa.royalsocietypublishing.org/content/108/747/501.citation#related-urls "On the Origin of the Auroral Green Line 5577 Å, and other Spectra Associated with the Aurora Borealis"]. Proceedings of the Royal Society A Mathematical, Physical & Engineering Sciences 108 (747): 501-12. doi:10.1098/rspa.1925.0088. on#related-urlshttp://rspa.royalsocietypublishing.org/content/108/747/501.citation#related-urls. Retrieved 2013-01-24.
- ↑ Anita L. Cochran, William D. Cochran (December 2001). "Observations of O (1S) and O (1D) in Spectra of C/1999 S4 (LINEAR)". Icarus 154 (2): 381-90. doi:10.1006/icar.2001.6718. http://arxiv.org/pdf/astro-ph/0108065v1.pdf. Retrieved 2013-01-16.
- 1 2 3 M. Spite and F. Spite (December 1991). "Oxygen abundance in metal-poor dwarfs, derived from the forbidden line". Astronomy and Astrophysics 252 (2): 689-92.
- 1 2 S. A. Hawley (September 1, 1978). "The chemical composition of galactic and extragalactic H II regions". The Astrophysical Journal 224 (9): 417-36. doi:10.1086/156389.
- ↑ Vimal Cylinder Supplier (2014). "Our Products : Liquid Oxygen". 30, Shilpi Appartment, 5th Floor, Kalanala, Bhavnagar-2, Gujarat: Vimal Cylinder Supplier. Retrieved 2016-03-12.
- ↑ "oxygen, In: Wiktionary". San Francisco, California: Wikimedia Foundation, Inc. September 16, 2013. Retrieved 2013-10-05.
- ↑ "Plasma cleaning, In: Wikipedia". San Francisco, California: Wikimedia Foundation, Inc. April 13, 2013. Retrieved 2013-05-28.
- 1 2 Samuel Epstein and Robert P. Sharp (January 1959). "Oxygen-isotope variations in the Malaspina and Saskatchewan Glaciers". The Journal of Geology 65 (1): 88-102. http://www.jstor.org/stable/30060071. Retrieved 2014-09-21.
- ↑ A. Jorissen, V.V. Smith, and D.L. Lambert (July 1992). "Fluorine in red giant stars: evidence for nucleosynthesis". Astronomy and Astrophysics 261 (1): 164-87. http://adsabs.harvard.edu/abs/1992A&A...261..164J. Retrieved 2013-08-01.
- ↑ Alex Petty (July 2007). "Fluorine light signature". alexpetty.com. Retrieved 2013-06-01.
- ↑ Yair Rosenthal, Edward A. Boyle, and Niall Slowey (1997). "Temperature control on the incorporation of magnesium, strontium, fluorine, and cadmium into benthic foraminiferal shells from Little Bahama Bank: Prospects for thermocline paleoceanography". Geochimica et Cosmochimica Acta 61 (17): 3633-43. http://boyle.mit.edu/~ed/PDFs/Rosenthal(1997)GCA.pdf. Retrieved 2014-09-22.
- ↑ Alex Petty (July 2011). "Neon light signature". alexpetty.com. Retrieved 2013-06-01.
- ↑ R. Hohmann, P. Schlosser, S. Jacobs, A. Ludin andR. Weppernig (November 2002). "Excess helium and neon in the southeast Pacific: Tracers for glacial meltwater". Journal of Geophysical Research Oceans (1978-2012) 107 (C11): 19-1–14. http://onlinelibrary.wiley.com/doi/10.1029/2000JC000378/full. Retrieved 2014-09-20.
- ↑ P. Oberholzer, C. Baroni, M.C. Salvatore, H. Baur and R. Wieler (2008). "Dating late Cenozoic erosional surfaces in Victoria Land, Antarctica, with cosmogenic neon in pyroxenes". Antarctic Science 20 (1): 89-98. doi:10.1017/S095410200700079X. http://www.taldice.org/pub/talos/Geology/Oberholzer_AS_2008.pdf. Retrieved 2014-09-29.
- 1 2 Cameron P. Wake, Paul Andrew Mayewski, Xie Zichu, Wang Ping, and Li Zhongquin (July 23 1993). "Regional Distribution of Monsoon and Desert Dust Signals Recorded in Asian Glaciers". Geophysical Research Letters 20 (14): 1411-4. http://digitalcommons.library.umaine.edu/cgi/viewcontent.cgi?article=1190&context=ers_facpub&sei-redir=1&referer=http%3A%2F%2Fscholar.google.com%2Fscholar%3Fq%3Dsodium%2Bglaciers%2B-acetic%2B-apples%26btnG%3D%26hl%3Den%26as_sdt%3D0%252C3#search=%22sodium%20glaciers%20-acetic%20-apples%22. Retrieved 2014-09-29.
- 1 2 3 "Forsterite, In: Wikipedia". San Francisco, California: Wikimedia Foundation, Inc. October 24, 2012. Retrieved 2013-01-22.
- 1 2 3 Ds. Lauretta, L.P. Keller, S. Messenger (2005). "Supernova olivine from cometary dust". Science 309 (5735): 737–741. doi:10.1126/science.1109602. PMID 15994379.
- ↑ Spitzer sees crystal 'rain' in outer clouds of infant star, Whitney Clavin and Trent Perrotto, Physorg.com, May 27, 2011 . Accessed May 2011
- ↑ "Dunite, In: Wikipedia". San Francisco, California: Wikimedia Foundation, Inc. January 13, 2013. Retrieved 2013-01-22.
- 1 2 3 4 5 6 7 8 9 10 11 12 13 14 15 16 17 18 19 Kozo Sadakane and Minoru Ueta (August 1989). "Abundance Analysis of Sirius in the Blue-Violet Region". Publications of the Astronomical Society of Japan 41 (2): 279-88.
- 1 2 3 T. Sivarani, P. Bonifacio, P. Molaro, R. Cayrel, M. Spite, F. Spite, B. Plez, J. Andersen, B. Barbuy, T. C. Beers, E. Depagne, V. Hill, P. François, B. Nordström, and F. Primas (January 2004). "First stars IV. CS 29497-030: Evidence for operation of the s-process at very low metallicity". Astronomy and Astrophysics 413 (1): 1073-85. doi:10.1051/0004-6361:20031590. http://arxiv.org/pdf/astro-ph/0310291.pdf. Retrieved 2012-06-02.
- 1 2 3 4 5 6 Sarah K. Fortner, Bryan G. Mark, Jeffrey M. McKenzie, Jeffrey Bury, Annette Trierweiler, Michel Baraer, Patrick J. Burns, and LeeAnn Munk (2011). "Elevated stream trace and minor element concentrations in the foreland of receding tropical glaciers". Applied Geochemistry 26: 1792-1801. http://www.geotop.ca/upload/files/publications/chercheur/McKenzieJ/Fortner%20et%20al_2011.pdf. Retrieved 2014-09-30.
- ↑ Peter S. Conti and Eva M. Leep (October 1974). "Spectroscopic observations of O-type stars. V. The hydrogen lines and lambda 4686 He II". The Astrophysical Journal 193 (10): 113-24. doi:10.1086/153135.
- ↑ D. Lal and B.L.K. Somayajulu (June 1984). "Some aspects of the geochemistry of silicon isotopes". Tectonophysics 105 (1-4): 383-97. doi:10.1016/0040-1951(84)90215-4. http://www.sciencedirect.com/science/article/pii/0040195184902154. Retrieved 2014-09-30.
- 1 2 "Allotropes of phosphorus, In: Wikipedia". San Francisco, California: Wikimedia Foundation, Inc. 20 March 2013. Retrieved 2013-03-20.
- ↑ Marek Stibal, Martyn Tranter, Jon Telling, Liane G. Benning (2008). "Speciation, phase association and potential bioavailability of phosphorus on a Svalbard glacier". Biogeochemistry 90 (1): 1-13. doi:10.1007/s10533-008-9226-3. http://link.springer.com/article/10.1007/s10533-008-9226-3. Retrieved 2014-06-24.
- 1 2 Renyang Zheng, Li Lin, Jinglin Xie, Yuexiang Zhu and Youchang Xie (September 10, 2008). "State of Doped Phosphorus and Its Influence on the Physicochemical and Photocatalytic Properties of P-doped Titania". Journal of Physical Chemistry C 112 (39): 15502-9. doi:10.1021/jp806121m. http://pubs.acs.org/doi/abs/10.1021/jp806121m?prevSearch=%2522dominant%2Bgroup%2522&searchHistoryKey=. Retrieved 2012-03-16.
- ↑ B. Alexander, M. H. Thiemens, J. Farquhar, A. J. Kaufman, J. Savarino and R. J. Delmas (December 2003). "East Antarctic ice core sulfur isotope measurements over a complete glacial-interglacial cycle". Journal of Geophysical Research: Atmospheres 108 (D24): 27. doi:10.1029/2003JD003513. http://onlinelibrary.wiley.com/doi/10.1029/2003JD003513/full. Retrieved 2014-09-30.
- 1 2 3 F.M. Phillips, D.Q. Bowen, and E. Elmore (1994). "Surface exposure dating of glacial features in Great Britain using cosmogenic chlorine-36: preliminary results". Mineralogical Magazine 58A: 722-3. http://rruff.info/doclib/MinMag/Volume_58A/58A-2-722.pdf. Retrieved 2014-09-21.
- ↑ "chlorine, In: Wiktionary". San Francisco, California: Wikimedia Foundation, Inc. August 28, 2013. Retrieved 2013-10-05.
- 1 2 3 4 5 6 7 P. Swings (July 1943). "Edlén's Identification of the Coronal Lines with Forbidden Lines of Fe X, XI, XIII, XIV, XV; Ni XII, XIII, XV, XVI; Ca XII, XIII, XV; a X, XIV". The Astrophysical Journal 98 (07): 116-28. doi:10.1086/144550.
- ↑ Jeffrey P. Severinghaus and Edward J. Brook (29 October 1999). "Abrupt Climate Change at the End of the Last Glacial Period Inferred from Trapped Air in Polar Ice". Science 286 (5441): 930-4. http://xa.yimg.com/kq/groups/399598/894440079/name/Severinghaus_Brook_Science_1999.pdf. Retrieved 2014-10-01.
- 1 2 3 P. G. Nutting (January 1906). "Line Structure. I.". The Astrophysical Journal 23 (1): 64-78. doi:10.1086/141302.
- ↑ Suzanne Prestrud Anderson, James I. Drever, and Neil F. Humphrey (1997). "Chemical weathering in glacial environments". Geology 25 (5): 399-402. doi:10.1130/0091-7613(1997)025<0399:CWIGE>2.3.CO;2. http://geology.gsapubs.org/content/25/5/399.short. Retrieved 2014-10-01.
- 1 2 3 4 5 6 G. Stellmacher and E. Wiehr (August 1991). "Geometric line elevation in solar limb faculae". Astronomy and Astrophysics 248 (1): 227-31.
- ↑ H. L. Shipman (April 1977). "Masses, radii, and model atmospheres for cool white-dwarf stars". The Astrophysical Journal 213 (4): 138-44. doi:10.1086/155138.
- 1 2 3 D. Van Rooij, N. Zaazi, N. Fagel, M. Boone, V. Cnudde, J. Dewanckele, H. Pirlet, U. Rohl, D. Blamart, J.-P. Henriet, P. Jacobs, H. Houbrechts, P. Duyck, and R. Swennen (2009). "3D anatomy of Heinrich Layer 2". Geophysical Research Abstracts 11 (EGU2009-4809-1): 1. http://meetingorganizer.copernicus.org/EGU2009/EGU2009-4809-1.pdf. Retrieved 2014-09-29.
- ↑ J. R. Kline, J. E. Foss and S. S. Brar (March 1969). "Lanthanum and Scandium Distribution in Three Glacial Soils of Western Wisconsin". Soil Science Society of America Journal 33 (2): 287-91. doi:10.2136/sssaj1969.03615995003300020034x. https://dl.sciencesocieties.org/publications/sssaj/abstracts/33/2/SS0330020287. Retrieved 2014-10-01.
- 1 2 G. Catanzaro (January 2010). "First spectroscopic analysis of β Scorpii C and β Scorpii E Discovery of a new HgMn star in the multiple system β Scorpii". Astronomy & Astrophysics 509: 7. doi:10.1051/0004-6361/200913332. http://www.aanda.org/articles/aa/pdf/2010/01/aa13332-09.pdf. Retrieved 2013-01-18.
- ↑ Kent S. Whiting and Gunter Faure (May 1991). "Transport of Magnetite and Ilmenite by Glaciers in the Adirondack Mountains of New York". The Journal of Geology 99 (3): 482-92. http://www.jstor.org/discover/10.2307/30062630?uid=3739552&uid=2&uid=4&uid=3739256&sid=21104257622971. Retrieved 2014-10-01.
- ↑ "Vanadium, In: Wikipedia". San Francisco, California: Wikimedia Foundation, Inc. January 21, 2013. Retrieved 2013-01-22.
- 1 2 3 GM Ivanov, VK Kashin (March 2010). "Vanadium in the landscapes of western Transbaikalia". Geochemistry International 48 (3): 295-9. doi:10.1134/S0016702910030067. http://link.springer.com/article/10.1134/S0016702910030067. Retrieved 2014-10-02.
- 1 2 Alain Plouffe (February 1998). "Detrital transport of metals by glaciers, an example from the Pinchi Mine, central British Columbia". Environmental Geology 33 (2-3): 183-96. doi:10.1007/s002540050237. http://link.springer.com/article/10.1007/s002540050237. Retrieved 2014-10-02.
- 1 2 D. H. Loring and D. J. G. Nota (November 1968). "Occurrence and Significance of Iron, Manganese, and Titanium in Glacial Marine Sediments from the Estuary of the St. Lawrence River". Journal of the Fisheries Research Board of Canada 25 (11): 2327-47. doi:10.1139/f68-204. http://www.nrcresearchpress.com/doi/abs/10.1139/f68-204#.VC2gtShORSU. Retrieved 2014-10-02.
- ↑ "Astronomical spectroscopy, In: Wikipedia". San Francisco, California: Wikimedia Foundation, Inc. December 8, 2012. Retrieved 2013-01-22.
- ↑ M. Rybansky, V. Rusin, M. Minarovjech and P. Gaspar (1994). "Coronal index of solar activity: Years 1939-1963". Solar Physics 152 (1): 153-9. doi:10.1007/BF01473198.
- ↑ Nathan Smith (March 2005). "Doppler tomography of the Little Homunculus: High‐resolution spectra of [Fe II λ16 435 around Eta Carinae"]. Monthly Notices of the Royal Astronomical Society 357 (4): 1330-6. doi:10.1111/j.1365-2966.2005.08750.x. http://onlinelibrary.wiley.com/doi/10.1111/j.1365-2966.2005.08750.x/full. Retrieved 2012-02-27.
- ↑ "Fraunhofer lines, In: Wikipedia". San Francisco, California: Wikimedia Foundation, Inc. March 13, 2013. Retrieved 2013-03-22.
- 1 2 3 Loes J.A. Gerringa, Anne-Carlijn Alderkamp, Patrick Laan, Charles-Edouard Thuróczy, Hein J.W. De Baar, Matthew M. Mills, Gert L. van Dijken, Hans van Haren, and Kevin R. Arrigo (2012). "Iron from melting glaciers fuels the phytoplankton blooms in Amundsen Sea (Southern Ocean): Iron biogeochemistry". Deep-Sea Research II 71-76: 16-31. http://nioz.eu/files/upload/users/305080/Publications/2012DSRII.pdf. Retrieved 2014-10-02.
- 1 2 3 4 S. N. Chillrud, F. L. Pedrozo, P. F. Temporetti, and H. F. Planas, and P. N. Froelich (1994). "Chemical weathering of phosphate and germanium in glacial meltwater streams: Effects of subglacial pyrite oxidation". Limnol. Oceanogr. 39 (5): 1130-40. http://www.aslo.org/lo/toc/vol_39/issue_5/1130.pdf. Retrieved 2014-11-02.
- ↑ Herbert Lettner, T. Wilflinger, A.K. Hubmer, P. Bossew (19-24 October 2008). Extreme radionuclide accumulation on alpine glaciers in cryoconites. Buenos Aires, Argentina: International Congress of the International Radiation Protection Association. pp. 1. https://inis.iaea.org/search/search.aspx?orig_q=RN:42103485. Retrieved 2014-10-22.
- ↑ Charles-Philippe Lienemann, Martial Taillepert, Didier Perret, and Jean-François Gaillard (1997). "Association of cobalt and manganese in aquatic systems: Chemical and microscopic evidence". Geochimica et Cosmochimica Acta 61 (7): 1437-46. http://shadow.eas.gatech.edu/~mtaillef/Research/GCA1997.pdf. Retrieved 2014-10-23.
- 1 2 3 4 A. N. Rencz and W. W. Shilts (1980). JO Nriagu. ed. Nickel in Soils and Vegetation of Glaciated Terrains, In: Nickel in the Environment. pp. 151-88. ftp://ftp.nrcan.gc.ca/ess/geochem/files/publications/pub_02115/rencz_shilts_1980.pdf. Retrieved 2014-10-28.
- ↑ A.B. Johnson Jr. and B. Francis (01 January 1980). Durability of metals from archaeological objects, metal meteorites, and native metals. PNL-3198. Richland, Washington USA: Battelle Pacific Northwest Laboratories, Department of Energy. doi:10.2172/5406419. http://www.osti.gov/scitech/biblio/5406419. Retrieved 2014-10-28.
- ↑ I.M. Kettles, A.N. Rencz, and S.D. Bauke (April 2000). "Integrating Landsat, Geologic, and Airborne Gamma Ray Data as an Aid to Surficial Geology Mapping and Mineral Exploration in the Manitouwadge Area, Ontario". Photogrammetric Engineering & Remote Sensing 66 (4): 437-45. http://asprs.org/a/publications/pers/2000journal/april/2000_apr_437-445.pdf. Retrieved 2014-10-28.
- 1 2 Silvia von der Weiden (21 March 2012). "As Greenland's Glaciers Recede, A Rush On The Riches Buried Below". WorldCrunch. Retrieved 2014-09-20.
- 1 2 Alan M. Shiller (June 1998). "Dissolved gallium in the Atlantic Ocean". Marine Chemistry 61 (1-2): 87-99. doi:10.1016/S0304-4203(98)00009-7. http://www.sciencedirect.com/science/article/pii/S0304420398000097. Retrieved 2014-10-29.
- ↑ A. Robertson Jr, T.H. Chiu, W.T. Tsang and J.E. Cunningham (1987). "RHEED Intensity Oscillation Studies of the Kinetics of GaAs Deposition During Chemical Beam Epitaxy (CBE)". MRS Proceedings 102: 17-23. doi:http://dx.doi.org/10.1557/PROC-102-17. http://journals.cambridge.org/abstract_S1946427400538469. Retrieved 2012-07-17.
- 1 2 M. A. C. Hotchkis, J. E. Reiff, D. J. Vieira, F. Blönnigen, T. F. Lang, D. M. Moltz, X. Xu, and Joseph Cerny (January 1987). "Beta-delayed proton decay of 61Ge". Physical Review C 35 (1): 315-9. doi:10.1103/PhysRevC.35.315. http://prc.aps.org/abstract/PRC/v35/i1/p315_1. Retrieved 2012-03-16.
- ↑ M. R. Melloch, J. M. Woodall, and E. S. Harmon, N. Otsuka, Fred H. Pollak, D. D. Nolte, R. M. Feenstra and M. A. Lutz (1995). "Low-temperature grown III-V materials". Annual Review of Materials Science 25 (1): 547-600. doi:10.1146/annurev.ms.25.080195.002555. http://www.annualreviews.org/doi/pdf/10.1146/annurev.ms.25.080195.002555. Retrieved 2013-08-29.
- ↑ W. Van Dokkum, R. H. De Vos, Th. Muys and J. A. Wesstra (1989). "Minerals and trace elements in total diets in the Netherlands". British Journal of Nutrition 61: 7-15. http://journals.cambridge.org/production/action/cjoGetFulltext?fulltextid=862736. Retrieved 2012-03-16.
- ↑ "Rubidium, In: Wikipedia". San Francisco, California: Wikimedia Foundation, Inc. July 23, 2013. Retrieved 2013-08-01.
- ↑ David L. Lambert, Verne V. Smith, Maurizio Busso, Roberto Gallino, and Oscar Straniero (September 1, 1995). "The Chemical Composition of Red Giants. IV. The Neutron Density at the s-Process Site". The Astrophysical Journal 450 (09): 302-17. doi:10.1086/176141. http://adsabs.harvard.edu/abs/1995ApJ...450..302L. Retrieved 2013-08-01.
- ↑ "xenon, In: Wiktionary". San Francisco, California: Wikimedia Foundation, Inc. October 5, 2013. Retrieved 2013-10-05.
- ↑ M. C. Festou and P. D. Feldman (November 1981). "The Forbidden Oxygen Lines in Comets". Astronomy & Astrophysics 103 (1): 154-9.
- ↑ Jean E. Sansonetti and W. C. Martin, and S. L. Young (December 9, 2011). "Handbook of Basic Atomic Spectroscopic Data". 100 Bureau Drive, Gaithersburg, Maryland USA: Physical Measurement Laboratory, NIST. Retrieved 2013-01-24.
- ↑ "radon, In: Wiktionary". San Francisco, California: Wikimedia Foundation, Inc. September 27, 2013. Retrieved 2013-10-05.
- ↑ Emperorbma (9 July 2015). "thorium, In: Wiktionary". San Francisco, California: Wikimedia Foundation, Inc. Retrieved 2015-07-16.
- ↑ Deharveng (November 11, 2008). "Glowing Stellar Nurseries". European Southern Observatory. Retrieved 2014-03-13.
- ↑ "Ion, In: Wikipedia". San Francisco, California: Wikimedia Foundation, Inc. June 27, 2012. Retrieved 2012-07-15.
- ↑ R. Wegmann, H.U. Schmidt, W.F. Huebner, and D.C. Boice (November 1987). "Cometary MHD and chemistry". Astronomy and Astrophysics 187 (1-2): 339-50.
- ↑ Jasmine E. Saros, Kevin C. Rose, David W. Clow, Verlin C. Stevens, Andrea B. Nurse, Heather A. Arnett, Jeffery R. Stone, Craig E. Williamson, and Alexander P. Wolfe (1 January 2010). "Melting Alpine Glaciers Enrich High-Elevation Lakes with Reactive Nitrogen". Environmental Science & Technology 44 (18): 4891-6. doi:10.1021/es100147j. http://digitalcommons.unl.edu/cgi/viewcontent.cgi?article=1119&context=geosciencefacpub&sei-redir=1&referer=http%3A%2F%2Fscholar.google.com%2Fscholar%3Fq%3Dnitrogen%2Bglaciers%26btnG%3D%26hl%3Den%26as_sdt%3D0%252C3#search=%22nitrogen%20glaciers%22. Retrieved 2014-09-20.
- ↑ SPACE.com Staff (January 14, 2013). "Baffling Star Birth Mystery Finally Solved". Yahoo! Inc. Retrieved 2013-01-15.
- 1 2 A. Hacar et al. (February 15, 2012). "APEX image of a tar-forming filament in Taurus". ESO. Retrieved 2014-03-13.
- ↑ N. Cordeiro, M.N. Belgacem, A.J.D. Silvestre, C. Pascoal Neto, A. Gandini (April 1998). "Cork suberin as a new source of chemicals.: 1. Isolation and chemical characterization of its composition". International Journal of Biological Macromolecules 22 (2): 71-80. doi:10.1016/S0141-8130(97)00090-1. http://www.sciencedirect.com/science/article/pii/S0141813097000901. Retrieved 2012-07-17.
- ↑ DE Fawzy, NH Youssef, O. Engvold (May 1998). "Identification of FeH molecular lines in the spectrum of a sunspot umbra". Astronomy and Astrophysics Supplement 129 (5): 435-43. doi:10.1051/aas:1998196. http://aas.aanda.org/articles/aas/abs/1998/09/h0667/h0667.html. Retrieved 2012-02-18.
- ↑ S.R. Federman, David L. Lambert (May 2002). "The need for accurate oscillator strengths and cross sections in studies of diffuse interstellar clouds and cometary atmospheres". Journal of Electron Spectroscopy and Related Phenomena 123 (2-3): 161-71. http://www.sciencedirect.com/science/article/pii/S0368204802000178. Retrieved 2013-01-20.
- ↑ B. M. Klenov and G. D. Chimitdorzhieva (October 2011). "Effect of Climate Continentality on Humus Formation and Elemental Composition of Humic Acids of Automorphic Soils of Siberia". Contemporary Problems of Ecology 4 (5): 492-6. doi:10.1134/S1995425511050067. http://www.springerlink.com/content/k8m53231t5303480/. Retrieved 2012-03-16.
- ↑ "Organic acid, In: Wikipedia". San Francisco, California: Wikimedia Foundation, Inc. June 9, 2012. Retrieved 2012-07-15.
- ↑ Toshio Fujita, Junkichi Iwasa, and Corwin Hansch (December 1964). "A New Substituent Constant, π, Derived from Partition Coefficients". Journal of the American Chemical Society 86 (23): 5175-80. doi:10.1021/ja01077a028. http://tryptophan.net/chem4120/Hansch-Pi.pdf. Retrieved 2011-08-16.
- 1 2 E. Bergin (March 4, 2010). "HIFI Spectrum of Water and Organics in the Orion Nebula". Pasadena, California USA: Caltech. Retrieved 2014-03-12.
- ↑ J Winkelmann (2007). M.D. Lechner. ed. Diffusion of water, In: Gases in Gases, Liquids and their Mixtures. 15A. Berlin: Springer-Verlag. 130-1. doi:10.1007/978-3-540-49718-9_29. ISBN 978-3-540-62429-5. http://link.springer.com/chapter/10.1007/978-3-540-49718-9_29. Retrieved 2015-07-17.
- ↑ Donald M. Hunten (February 12, 1993). "Atmospheric Evolution of the Terrestrial Planets". Science 259 (5097): 915-20. http://www.csun.edu/~hmc60533/CSUN_311/article_references/Sc_Feb93_AtmosEvolTerrestPlanets.pdf. Retrieved 2014-09-21.
- ↑ Bragi Árnason (1969). "The exchange of hydrogen isotopes between ice and water in temperature glaciers". Earth and Planetary Science Letters 6 (6): 423-30. doi:10.1016/0012-821X(69)90111-3. http://adsabs.harvard.edu/abs/1969E%26PSL...6..423A. Retrieved 2014-09-20.
- 1 2 3 4 P. Sonnentrucker, D. A. Neufeld, T. G. Phillips, M. Gerin, D. C. Lis, M. De Luca, J. R. Goicoechea, J. H. Black, T. A. Bell, F. Boulanger, J. Cernicharo, A. Coutens, E. Dartois, M . Kaźmierczak, P. Encrenaz, E. Falgarone, T. R. Geballe, T. Giesen, B. Godard, P. F. Goldsmith, C. Gry, H. Gupta, P. Hennebelle, E. Herbst, P. Hily-Blant, C. Joblin, R. Kołos, J. Krełowski, J. Martín-Pintado, K. M. Menten, R. Monje, B. Mookerjea, J. Pearson, M. Perault, C. M. Persson, R. Plume, M. Salez, S. Schlemmer, M. Schmidt, J. Stutzki, D.Teyssier, C. Vastel, S. Yu, E. Caux, R. Güsten, W. A. Hatch, T. Klein, I. Mehdi, P. Morris and J. S. Ward (October 1, 2010). "Detection of hydrogen fluoride absorption in diffuse molecular clouds with Herschel/HIFI: a ubiquitous tracer of molecular gas". Astronomy & Astrophysics 521: 5. doi:10.1051/0004-6361/201015082. http://www.aanda.org/articles/aa/abs/2010/13/aa15082-10/aa15082-10.html. Retrieved 2013-01-17.
- ↑ D. C. Lis, J. C. Pearson, D. A. Neufeld, P. Schilke, H. S. P. Müller,H. Gupta, T. A. Bell, C. Comito, T. G. Phillips, E. A. Bergin, C. Ceccarelli, P. F. Goldsmith, G. A. Blake, A. Bacmann, A. Baudry, M. Benedettini, A. Benz, J. Black, A. Boogert, S. Bottinelli, S. Cabrit, P. Caselli, A. Castets, E. Caux, J. Cernicharo, C. Codella, A. Coutens, N. Crimier, N. R. Crockett, F. Daniel, K. Demyk, C. Dominic, M.-L. Dubernet, M. Emprechtinger, P. Encrenaz, E. Falgarone, A. Fuente, M. Gerin, T. F. Giesen, J. R. Goicoechea, F. Helmich, P. Hennebelle, Th. Henning, E. Herbst, P. Hily-Blant, Å. Hjalmarson, D. Hollenbach, T. Jack, C. Joblin, D. Johnstone, C. Kahane, M. Kama, M. Kaufman, A. Klotz, W. D. Langer, B. Larsson, J. Le Bourlot, B. Lefloch, F. Le Petit, D. Li, R. Liseau, S. D. Lord, A. Lorenzani, S. Maret, P. G. Martin, G. J. Melnick, K. M. Menten, P. Morris, J. A. Murphy, Z. Nagy, B. Nisini, V. Ossenkopf, S. Pacheco, L. Pagani, B. Parise, M. Pérault, R. Plume, S.-L. Qin, E. Roueff, M. Salez, A. Sandqvist, P. Saraceno, S. Schlemmer, K. Schuster, R. Snell, J. Stutzki, A. Tielens, N. Trappe, F. F. S. van der Tak, M. H. D. van der Wiel, E. van Dishoeck, C. Vastel, S. Viti, V. Wakelam, A. Walters, S. Wang, F. Wyrowski, H. W. Yorke, S. Yu, J. Zmuidzinas, Y. Delorme, J.-P. Desbat, R. Güsten, J.-M. Krieg, and B. Delforge (October 1, 2010). "Herschel/HIFI discovery of interstellar chloronium (H2Cl+)". Astronomy & Astrophysics 521: 5. doi:10.1051/0004-6361/201014959. http://www.aanda.org/articles/aa/abs/2010/13/aa14959-10/aa14959-10.html. Retrieved 2013-01-18.
- 1 2 3 4 5 eso1137a (October 3, 2011). "Antennae Galaxies composite of ALMA and Hubble observations". Parana, Chile: European Southern Observatory. Retrieved 2014-03-13.
- ↑ F. Vigué, E. Tournié, J.-P. Faurie (January 2000). "Zn(Mg)BeSe-based p-i-n photodiodes operating in the blue-violet and near-ultraviolet spectral range". Applied Physics Letters 76 (2): 242-4. doi:10.1063/1.125715. http://ieeexplore.ieee.org/xpls/abs_all.jsp?arnumber=4915124. Retrieved 2013-06-01.
- 1 2 3 SemperBlotto (15 February 2006). "inorganic compound, In: Wiktionary". San Francisco, California: Wikimedia Foundation, Inc. Retrieved 2015-07-19.
- ↑ William T. A. Harrison, Tina M. Nenoff, Thurman E. Gier, Galen D. Stucky (December 1992). "Tetrahedral-atom zincophosphate structures. Zinc diethyl phosphate, [Zn(O2P(OC2H5)2)2x, a one-dimensional inorganic" polymer""]. Inorganic Chemistry 31 (26): 5395-9. doi:10.1021/ic00052a014. http://www.dtic.mil/cgi-bin/GetTRDoc?AD=ADA263040. Retrieved 2012-03-16.
- ↑ Melanie D. Tudor, Jennifer J. Becker, Peter S. White, and Michel R. Gagné (September 22, 2000). "Diastereoisomer Interconversion in Chiral BiphepPtX2 Complexes". Organometallics 19 (21): 4376-84. doi:10.1021/om000629a. http://pubs.acs.org/doi/abs/10.1021/om000629a. Retrieved 2012-03-16.
- ↑ Li Xu, Yu-Fei Ma, Kuan-Zhen Tang, Yu Tang, Wei-Sheng Liu and Min-Yu Tan (July 2008). "Preparation, Characterization and Photophysical Properties of Highly Luminescent Terbium Complexes Incorporated Into SiO2/Polymer Hybrid Material". Journal of Fluorescence 18 (3-4): 685-93. doi:10.1007/s10895-008-0344-z. http://www.springerlink.com/content/l202x50907647710/. Retrieved 2012-03-16.
- ↑ M. Avella, E. Bonadies, E. Martuscelli, R Rimedio (2001). "European current standardization for plastic packaging recoverable through composting and biodegradation". Polymer Testing 20 (5): 517-21. doi:10.1016/S0142-9418(00)00068-4. http://www.sciencedirect.com/science/article/pii/S0142941800000684. Retrieved 2012-07-17.
- ↑ Changwen Du, Mingjiang Lei, Jianmin Zhou, Huoyan Wang, Xiaoqin Chen, Yuhua Yang (February 2011). "Effect of long‐term fertilization on the transformations of water‐extractable phosphorus in a fluvo‐aquic soil". Journal of Plant Nutrition and Soil Science 174 (1): 20-7. doi:10.1002/jpln.200900281. http://onlinelibrary.wiley.com/doi/10.1002/jpln.200900281/abstract. Retrieved 2012-03-16.
- ↑ Peter G. Wester and Jacob de Boer, Udo A. Th. Brinkman (January 29, 1996). "Determination of Polychlorinated Terphenyls in Aquatic Biota and Sediment with Gas Chromatography/Mass Spectrometry Using Negative Chemical Ionization". Environmental Science & Technology 30 (2): 473-80. doi:10.1021/es950154s. http://pubs.acs.org/doi/abs/10.1021/es950154s?prevSearch=%2522dominant%2Bgroup%2522&searchHistoryKey=. Retrieved 2012-03-16.
- ↑ Alejandro Montoya, Thanh N. Truong, and Adel F. Sarofim (August 19, 2000). "Application of Density Functional Theory to the Study of the Reaction of NO with Char-Bound Nitrogen during Combustion". The Journal of Physical Chemistry 104 (36): 8409-17. doi:10.1021/jp001045p. http://pubs.acs.org/doi/abs/10.1021/jp001045p. Retrieved 2012-03-16.
- ↑ Yanru Yang and Perry L. McCarty (September 26, 1998). "Competition for Hydrogen within a Chlorinated Solvent Dehalogenating Anaerobic Mixed Culture". Environmental Science & Technology 32 (22): 3591-7. doi:10.1021/es980363n. http://pubs.acs.org/doi/abs/10.1021/es980363n. Retrieved 2012-03-16.
- ↑ Eric Leighton Holmes, Christopher Kelk Ingold, and Edith Hilda Ingold (1926). "CCXX.—The Nature of the Alternating Effect in Carbon Chains. Part VII. A Study of the Relative Directive Efficiencies of Oxygen and Sulphur in Aromatic Substitution". Journal of the Chemical Society: 1684-90. doi:10.1039/JR9262901684. http://pubs.rsc.org/en/content/articlepdf/1926/jr/jr9262901684. Retrieved 2012-02-22.
- ↑ E. Franklin Armstrong and Henry E. Armstrong (June 1913). "Studies on the Processes Operative in Solutions (XXX) and on Enzyme Action (XX).--The Nature of Enzymes and of their Action as Hydrolytic Agents". Proceedings of the Royal Society London B Biological Sciences 86 (568): 561-86. doi:10.1098/rspb.1913.0051. http://rspb.royalsocietypublishing.org/content/86/591/561.full.pdf. Retrieved 2012-02-22.
- ↑ "Volatile organic compound, In: Wikipedia". San Francisco, California: Wikimedia Foundation, Inc. July 8, 2012. Retrieved 2012-07-15.
- 1 2 Seth Borenstein (28 August 2007). "Scientists Find New Global Warming 'Time Bomb’". the We. Retrieved 2014-09-20.
- ↑ Vladimir Romanovsky (28 August 2007). "Scientists Find New Global Warming 'Time Bomb’". the We. Retrieved 2014-09-20.
- ↑ Seth Borenstein (September 7, 2007). "Scientists Find New Global Warming 'Time Bomb’". Common Dreams News Center. Retrieved 2014-09-20.
- 1 2 3 holander (7 September 2012). "Liquid methane gas alternative for diesel fuel". The Netherlands: holander.nl. Retrieved 2015-06-16.
- ↑ NASA (19 July 2008). "Liquid Methane-Powered Rocket Engine". TecheBlog. Retrieved 2015-06-16.
- ↑ "alcohol, In: Wiktionary". San Francisco, California: Wikimedia Foundation, Inc. 5 July 2015. Retrieved 2015-07-20.
- ↑ Alexander J. MacLeod and Carl H. Snyder (May 1985). "Volatile components of two cultivars of mango from Florida". Journal of Agricultural and Food Chemistry 33 (3): 380-4. http://pubs.acs.org/doi/abs/10.1021/jf00063a015. Retrieved 2011-11-28.
- ↑ Murthy A. Vairavamurthy, Dusan Maletic, Shenkhe Wang, Bernard Manowitz, Timothy Eglinton, and Timothy Lyons (May 20, 1997). "Characterization of Sulfur-Containing Functional Groups in Sedimentary Humic Substances by X-ray Absorption Near-Edge Structure Spectroscopy". Energy & Fuels 11 (3): 546-53. doi:10.1021/ef960212a. http://pubs.acs.org/doi/abs/10.1021/ef960212a. Retrieved 2012-03-16.
- ↑ "Compendium of Chemical Terminology (IUPAC "Gold Book")".
- ↑ "Functional group, In: Wikipedia". San Francisco, California: Wikimedia Foundation, Inc. July 8, 2012. Retrieved 2012-07-15.
- ↑ W. W. Duley, D. A. Williams (July 1981). "The infrared spectrum of interstellar dust-Surface functional groups on carbon". Royal Astronomical Society, Monthly Notices 196 (7): 269-74.
- ↑ Rebecca E. Countway, Rebecca M. Dickhut, Elizabeth A. Canuel (February 2003). "Polycyclic aromatic hydrocarbon (PAH) distributions and associations with organic matter in surface waters of the York River, VA Estuary". Organic Geochemistry 34 (2): 209-24. doi:10.1016/S0146-6380(02)00162-6. http://www.sciencedirect.com/science/article/pii/S0146638002001626. Retrieved 2012-03-16.
- ↑ G. Frederick Wooten, Roswell Eldridge, Julius Axelrod, and Robert S. Stern (February 8, 1973). "Elevated Plasma Dopamine-β-Hydroxylase Activity in Autosomal Dominant Torsion Dystonia". New England Journal of Medicine 288 (2): 284-7. doi:10.1056/nejm197302082880604. http://www.nejm.org/doi/full/10.1056/nejm197302082880604. Retrieved 2012-03-16.
- 1 2 Elyana Cuevas Montilla, Silke Hillebrand, Daniela Butschbach, Susanne Baldermann, Naoharu Watanabe, and Peter Winterhalter (August 23, 2010). "Preparative Isolation of Anthocyanins from Japanese Purple Sweet Potato (Ipomoea batatas L.) Varieties by High-Speed Countercurrent Chromatography". Journal of Agricuture & Food Chemistry 58 (18): 9899-904. doi:10.1021/jf101898j. http://pubs.acs.org/doi/abs/10.1021/jf101898j?prevSearch=%2522dominant%2Bgroup%2522&searchHistoryKey=. Retrieved 2012-03-16.
- 1 2 "Photopsin, In: Wikipedia". San Francisco, California: Wikimedia Foundation, Inc. February 26, 2013. Retrieved 2013-03-26.
- ↑ W. A. H. Rushton (1 June 1966). "Densitometry of pigments in rods and cones of normal and color defective subjects" (PDF). Investigative Ophthalmology 5 (3): 233–41. PMID 5296487. http://www.iovs.org/cgi/content/abstract/5/3/233. Retrieved 2006-11-14.
- 1 2 T. L. Smith and A. N. Witt (December 1999). "The Photoluminescence Efficiency of Extended Red Emission as a Constraint for Interstellar Dust". Bulletin of the American Astronomical Society 31: 1479. http://adsabs.harvard.edu/abs/1999AAS...195.7406S. Retrieved 2013-08-02.
- ↑ Daniel T. Britt, Carle M. Pieters, and Peter H. Schultz (December 1986). "Source of the optical red-slope in iron-rich meteorites". Meteoritics 21 (12): 340-1. http://adsabs.harvard.edu/full/1986Metic..21..340B. Retrieved 2013-08-02.
- ↑ "mineraloid, In: Wiktionary". San Francisco, California: Wikimedia Foundation, Inc. April 20, 2011. Retrieved 2012-10-23.
- ↑ "petroleum, In: Wiktionary". San Francisco, California: Wikimedia Foundation, Inc. 16 July 2014. Retrieved 2015-01-09.
- 1 2 3 Jane Beitler (2014). "All About Snow". National Snow and Ice Data Center. Retrieved 2014-09-17.
- ↑ David Jewitt and Jane Luu (November 1992). "Submillimeter Continuum Emission from Comets". Icarus 108 (1): 187-96. http://www.sciencedirect.com/science/article/pii/0019103592900286. Retrieved 2013-10-22.
- ↑ M. Maercker et al. (October 10, 2012). "Curious spiral spotted by ALMA around red giant star R Sculptoris (data visualisation)". Atacama, Chile: European Southern Observatory. Retrieved 2014-03-12.
External links
| |||||||||||||||||||||||||||||||||||
![]() This is a research project at http://en.wikiversity.org
This is a research project at http://en.wikiversity.org
| |
Development status: this resource is experimental in nature. |
| |
Educational level: this is a research resource. |
| |
Resource type: this resource is an article. |
| |
Resource type: this resource contains a lecture or lecture notes. |
| |
Subject classification: this is a chemistry resource . |