Astronomy/Backgrounds
< Astronomy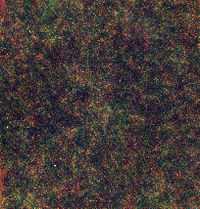
In each effort to measure some property of the universe there is a background in the measurement. Some understanding of the background is needed to separate the property to be measured from it. That understanding and its measurement is background astronomy.
Astronomy
"[T]here are ... several astrophysical components contributing to the sky background: these could be sets of point sources like faint asteroids, Galactic stars and far away galaxies, as well as diffuse sources like dust in the Solar System, in the Milky Way, and in the intergalactic space."[1]
Theoretical background astronomy
Def. a persistent level of some phenomenon or process, against which particular events or measurements are distinguished is called a background.
"There are empirical approaches that predict the overall SED of the EBL in the local Universe as well as its evolution over time. These types of modeling can be divided in four different categories according to.[2]"[3]
(i) Forward evolution, which begins with cosmological initial conditions and follows a forward evolution with time by means of semi-analytical models of galaxy formation.[4][5][6]
(ii) Backward evolution, which begins with existing galaxy populations and extrapolates them backwards in time.[7][8][9]
(iii) Evolution of the galaxy populations that is inferred over a range of redshifts. The galaxy evolution is inferred here using some quantity derived from observations such as the star formation rate density of the universe.[10][11][12]
(iv) Evolution of the galaxy populations that is directly observed over the range of redshifts that contribute significantly to the EBL.[2]
Entities
"By the words "warm cloud," we refer to the extended continuum emission -- characteristically several arcminutes in extent -- which can be detected as entities in the FIR and submillimeter regions of the spectrum."[13]
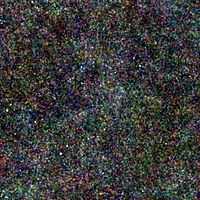
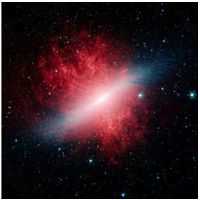
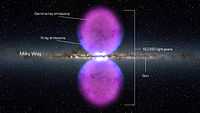
"The Herschel Space Observatory has revealed [in the image at the top of the page] how much dark matter it takes to form a new galaxy bursting with stars."[14]
"If you start with too little dark matter, then a developing galaxy would peter out."[15]
"If you have too much, then gas doesn't cool efficiently to form one large galaxy, and you end up with lots of smaller galaxies. But if you have the just the right amount of dark matter, then a galaxy bursting with stars will pop out."[15]
"This remarkable discovery shows that early galaxies go through periods of star formation much more vigorous than in our present-day Milky Way."[16]
"It showcases the importance of infrared astronomy, enabling us to peer behind veils of interstellar dust to see stars in their infancy."[16]
"It turns out that it's much more effective to look at these patterns rather than the individual galaxies."[17]
"This is like looking at a picture in a magazine from a reading distance. You don't notice the individual dots, but you see the big picture. Herschel gives us the big picture of these distant galaxies, showing the influence of dark matter."[17]
"A region of the sky [on the right, the same as in the page-top image] called the "Lockman Hole", located in the constellation of Ursa Major, is one of the areas surveyed in infrared light by the Herschel Space Observatory. All of the little dots in this picture are distant galaxies. The pattern of their collective light is what's known as the cosmic infrared background. By studying this pattern, astronomers were able to measure how much dark matter it takes to create a galaxy bursting with young stars."[18]
Sources
"Do we know enough about the intergalactic medium to trust measurements of background sources seen through foreground structure?"[19]
Electromagnetics
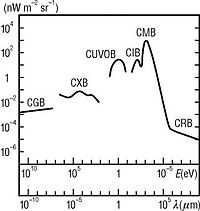
In the figure at right, CUVOB stands for the cosmic ultraviolet and optical background.
"The diffuse extragalactic background radiation (DEBRA) refers to the diffuse photon field from extragalactic origin that fill our Universe. It contains photons over ∼ 20 decades of energy from ~10−7 eV to ~100 GeV. The origin and the physical processes involved are different within every wavelength range. There are plenty of observational evidences that support the existence of the DEBRA.[20]"[21]
The figure at right "shows a schematic picture, based on many different data sets, of the spectral intensity (also called spectral radiance) multiplied by wavelength of the DEBRA over all the electromagnetic spectrum. This representation is convenient because the area inside the curve is the energy. The nature and history of the universe is coded in this radiation field and any realistic cosmological model must be able to describe it. Understanding the DEBRA is a major challenge of modern cosmology with huge consequences in other fields of astrophysics, therefore extraordinary efforts are being put by theoreticians, observers, and instrumentalists to do so."[21]
"The diffuse extragalactic background light (EBL) is all the accumulated radiation in the Universe due to star formation processes, plus a contribution from active galactic nuclei (AGNs). This radiation covers the wavelength range between ~ 0.1-1000 microns (these are the ultraviolet, optical, and infrared regions of the electromagnetic spectrum). The EBL is part of the diffuse extragalactic background radiation (DEBRA), which by definition covers the overall electromagnetic spectrum. After the cosmic microwave background, the EBL produces the second-most energetic diffuse background, thus being essential for understanding the full energy balance of the universe."[3]
Meteors
"The temperature distribution of the intergalactic medium (IGM) depends on whether or not there exist strong galactic winds."[22]
It "may be possible for a heated IGM with sufficient pressure to inhibit outflows from star-forming protogalaxies. Mass loss from early objects through galactic winds or evaporation is often invoked to explain the ubiquitous presence of metals in the Lyα forest clouds at z ∼ 3; a pre-heated IGM could, however, hinder such outflows of metal-enriched gas from host galaxies at sufficiently high redshifts (prior to reionization)."[23]
At right is a Spitzer Infrared Telescope image that shows in red the outflow from galaxy M82 of polycyclic aromatic hydrocarbons (PAH)s embedded in a gaseous wind propelled out of the galaxy by hot stars in the stellar disk (blue).
"In November 2010, ... two gigantic gamma-ray bubbles were detected at the heart of our galaxy. These bubbles appear as a mirror image[24] of each other. These bubbles of high-energy radiation are suspected as erupting from a massive black hole or evidence of a burst of star formations from millions of years ago.[25] These bubbles have been measured and span 25,000 light-years across. They were discovered after scientists filtered out the "fog of background gamma-rays suffusing the sky". This discovery confirmed previous clues that a large unknown "structure" was in the center of the Milky Way.[26][27]"[28].
The bubbles "stretch up to Grus and to Virgo on the night-sky of the southern hemisphere"[29].
Subatomics
"High energy neutrinos may interact to produce a large cascade of particles. In this case, the production of Cherenkov light remains localized and the photons propagation radially outward (well, almost). The effective volume of AMANDA is much smaller for cascades than muons and the angular resolution is very poor, but there are several interesting features of cascades that make them useful to study. First, the energy resolution of the cascade event can be measured with much better precision relative to the muon signature if the vertex of the interaction is contained. Second, the backgrounds from atmospheric electron neutrinos is much smaller than muon neutrinos at these energies because the decay of atmospheric muons is suppressed by time dilation. Third, cascades are produced by electron neutrinos and tau neutrinos so the ratio of cascades to muon neutrino events provides insight on the properties of neutrino oscillation. Fourth, even downgoing neutrinos can be observed if the energy is larger than ~10 TeV. Thus, the cascade technique is sensitive to neutrinos from any direction."[30]
"Like with accelerator physics, most of the interest [in] neutrino astrophysics is at the extreme energy frontier, which we label "extreme high energy" or EHE. Perhaps the most reliable flux predictions (after atmospheric neutrinos) involve the GZK mechanism. Neutrinos are produced by the inevitable collisions between cosmic rays and the cosmic microwave background. Although the physics required by GZK mechanism is straightforward, the GZK mechanism is still in doubt because one of its predictions has not yet been confirmed. The GZK mechanism predicts are rather strong upper limit on the energy of the cosmic ray, but this upper limit has not yet been clearly identified."[30]
"The EHE analysis relies on training a neural net (NN2) to separate background from signal."[30]
Neutrons
"The main components of background noise in neutron detection are high-energy photons, which aren't easily eliminated by physical barriers."[31]
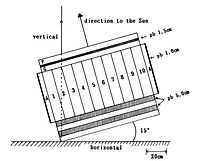
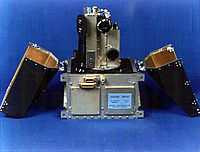
"The solar neutron telescope [image at right] consists of 10 blocks of scintillator [...] and several lead plates which are used to place kinetic energies Tn of incoming particles into three bands (50-360 MeV, 280-500 MeV, and ≥ 390 MeV)."[32] The telescope is inclined to the direction of the Sun by 15°.[32] The plane area of the detector is 1.0 m2 and protected by lead plates (Pb) to eliminate gamma-ray and muon background from the side of the detector.[32] The anti-coincident counter (A) is used to reject the muons and gamma rays, coming from the side of the detector and the top scintillators.[32] (P) and (G) are used to identify the proton events and gamma rays.[32] The central scintillator blocks are optically separated into 10 units.[32]
Protons
The [cosmic infrared background] "CIB [causes] a significant attenuation for very high energy ... protons ... through inverse Compton scattering, photopion and electron-positron pair production."[33]
Electrons
In infrared astronomy, "the [cosmic infrared background] CIB [causes] a significant attenuation for very high energy electrons ... through inverse Compton scattering, photopion and electron-positron pair production."[33]
Positrons
"The major problems associated with the balloon borne positron measurements are (i) the unique identification against a vast background of protons, and (ii) corrections for the positrons produced in the residual atmosphere."[34]
"[Taking] advantage of the relative stability of the background pattern to rewrite the background term as:"

"where  is a normalization coefficient per pointing,
  is the "uniformity map" or background count rate pattern on the SPI camera [of the INTEGRAL satellite] and
  the effective observation time for pointing p. and
  are vectors of 19 elements (one per detector)."[35]
"As 26Al is a positron emitting isotope, it is possible to measure 26Al in meteorites by gamma-coincidence low level counting techniques [1]. Positron annihilation radiation (due to the destructive recombination of a positron and an electron) is emitted as two simultaneous 511 keV gamma rays with 180° angle correlation. By focusing exclusively on the coincident 511 keV events, a drastic reduction of the detected radiation background is achieved, and the non-destructive determination of 26Al in bulk samples of 5-50 g becomes possible."[36]
Muons
"A total of 1555 events are shown in the [figure at the right] (in equatorial coordinates). Compared to the previous sky map from AMANDA-B10, the coverage near the horizon (declination = 0 degrees) is markedly improved. The angular resolution of AMANDA-II is much improved so the angular dimensions of a search bin are likely to be reduced to 6x6 square degrees. The downgoing atmospheric muon background is responsible for the thick band of events below the horizon. Less than 3% of the events above a declination of 5 degrees are due to atmospheric muon contamination."[30]
"To reduce the background of ordinary cosmic ray showers, several large air shower experiments emphasize measurement of the muon content of the shower. Ironically, early indications are that the signal seems to have the same muon content as the background."[37]
"The main background to the upgoing muon flux is atmospheric neutrinos generated by cosmic ray collisions. At high energy energies, direct production by charm decay becomes important, although the predicted fluxes have large uncertainty. As the neutrino energies increase beyond 107 GeV, most of the signal comes from above or very near the horizon and perhaps prompt MUONs from charm quark decay become a significant background. The importance of the background depends on the magnitude of the flux and detector energy and angular resolution. Fortunately, the sensitivity of AMANDA-II is not impacted by charm contributions for the most of the favored models of charm production in the atmosphere."[30]
"The atmosphere is so tenuous at higher altitudes that even at 15,000 m it is still only 175 g/cm2 deep. Typically, it is about here that most muons are generated. Muons arrive at sea level with an average flux of about 1 muon per square centimeter per minute. This is about half of the typical total natural radiation background."[38]
"The trick is to distinguish muons coming from the relatively few high-energy neutrinos from a sea of background muons, generated constantly by showers of lower-energy atmospheric neutrinos and other subatomic interactions. To help differentiate cosmic neutrinos from the background, IceCube’s DOMs are positioned to “look down” through the planet to the Northern Hemisphere. In effect, Earth’s interior acts as a filter. Because muons decay over distances of only a few kilometers, any muons that arrive at the detector from below must arise from neutrinos that have passed through the planet."[39]
Neutrinos
"In 1987, astronomers counted 19 neutrinos from an explosion of a star in the nearby Large Magellanic Cloud, 19 out of the billion trillion trillion trillion trillion neutrinos that flew from the supernova."[40]
“Because neutrinos are only weakly interacting with other particles of matter, neutrino detectors must be very large in order to detect a significant number of neutrinos. Neutrino detectors are often built underground to isolate the detector from cosmic rays and other background radiation.[40]”[41]
In theory, the “cosmic neutrino background (CNB) is the background particle radiation composed of neutrinos as a relic of the big bang which decoupled from matter when the universe was 2 seconds old.”[42]
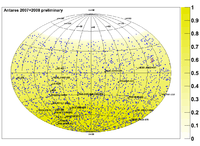
The fifth image at right shows an equatorial "skymap of neutrino-induced muon events from 295 days of ANTARES data in 2007/2008. The background color scale indicates the sky visibility in percent of the time. The most significant accumulation of events, marked with a red circle, is fully compatible with the background expectation"[43]
Gamma-rays
In gamma-ray astronomy, "when cosmic rays [such as protons] interact with ordinary matter ... pair-production gamma rays at 511 keV [are produced that are included in] the gamma ray background"[44].
"[T]hree-dimensional electromagnetic cascade[s are] initiated by interactions of the multi-TeV γ-rays with the cosmological infrared/optical photon background in the intergalactic medium. Secondary electrons in the cascade are deflected by the intergalactic magnetic fields before they scatter on [cosmic microwave background] CMB photons. This leads to extended 0.1-10 degree scale emission at multi-GeV and TeV energies around extragalactic sources of very-high-energy γ-rays."[45]
"The most critical feature of GRB analysis is the very modest background rejection requirements. GRB emit gamma radiation over short duration, typically less than 100s. Satellites provide time and direction information so the analysis needs to reject only non-neutrino events that happen to occur at the right time and reconstruct with the right direction. The upshot: the effective size of AMANDA-II for GRB analysis approaches 50,000 m2 for muons created by neutrinos."[30]
The "neutrino fluxes [may be] predicted by such scenarios [as the standard model or grand unification] if consistency with the observed cosmic ray flux and the universal γ-ray background at 1 − 10 GeV is required. Flux levels detectable by proposed km3 scale neutrino observatories are allowed by these constraints. Bounds on or detection of a neutrino flux above ~ 1 EeV would allow neutrino astronomy to probe grand unification scale physics."[46]
"The shapes of the [ultra-high energy] UHE nucleon and γ-ray spectra predicted within ["top-down"] TD models are “universal” in the sense that they depend only on the physics of [a supermassive elementary "X" particle associated with some grand unified theory (GUT)] X particle decay."[46]
"In contrast to the universality of UHE spectral shapes, the predicted γ-ray flux below ∼ 1014 eV (the threshold for pair production of photons on the [cosmic microwave background] CMB) and the predicted neutrino flux depend on the total energy release integrated over redshift and thus on the specific TD model."[46]
"Observational data on the universal γ-ray background in the 1 − 10 GeV region [27], to which the generic cascade spectrum would contribute directly, turn out to provide an important constraint. Since the UHE γ-ray flux is especially sensitive to certain astrophysical parameters such as the extragalactic magnetic field (EGMF), a reliable calculation of the predicted spectral shapes requires numerical methods."[46]
"The calculations take into account all the relevant interactions with the (redshift dependent) universal low energy photon background in the radio, microwave and optical/infrared regime."[46]
"Above ≃ 100 EeV the corresponding fluxes would dominate all present model predictions for AGN neutrino fluxes [14] as well as the flux of “cosmogenic” neutrinos produced by interactions of UHE [cosmic rays] CRs with the universal photon background [37,38,31]."[46]
The "constraint imposed by requiring that TD scenarios do not overproduce the measured universal γ-ray background at 1 − 10 GeV implies an upper limit on these neutrino fluxes which only depends on the ratio r of energy injected into the neutrino versus [electromagnetic] EM channel, and not on any specific TD scenario or even a possible connection to UHE CRs."[46]
"In March 2010 it was announced that active galactic nuclei are not responsible for most gamma-ray background radiation.[47] Though active galactic nuclei do produce some of the gamma-ray radiation detected here on Earth, less than 30% originates from these sources. The search now is to locate the sources for the remaining 70% or so of all gamma-rays detected. Possibilities include star forming galaxies, galactic mergers, and yet-to-be explained dark matter interactions."[48]
X-rays
"In addition to discrete sources which stand out against the sky, there is good evidence for a diffuse X-ray background.[49] During more than a decade of observations of X-ray emission from the Sun, evidence of the existence of an isotropic X-ray background flux was obtained in 1956.[50] This background flux is rather consistently observed over a wide range of energies.[49] The early high-energy end of the spectrum for this diffuse X-ray background was obtained by instruments on board Ranger 3 and Ranger 5.[49] The X-ray flux corresponds to a total energy density of about 5 x 10⁻⁴ eV/cm3.[49] The ROSAT soft X-ray diffuse background (SXRB) image shows the general increase in intensity from the Galactic plane to the poles. At the lowest energies, 0.1 - 0.3 keV, nearly all of the observed soft X-ray background (SXRB) is thermal emission from ~106 K plasma."[51]
"By comparing the soft X-ray background with the distribution of neutral hydrogen, it is generally agreed that within the Milky Way disk, super soft X-rays are absorbed by this neutral hydrogen."[51]
There is an “extensive 1/4 keV emission in the Galactic halo”, an “observed 1/4 keV [X-ray emission originating] in a Local Hot Bubble (LHB) that surrounds the Sun. ... and an isotropic extragalactic component.”[52] In addition to this “distribution of emission responsible for the soft X-ray diffuse background (SXRB) ... there are the distinct enhancements of supernova remnants, superbubbles, and clusters of galaxies.”[52]
The diffuse cosmic X-ray background is indicated in the figure at right with the notation CXB.
"Gas that gets heated to kT 10 keV would not be confined in cluster potential wells, but would constitute a roughly homogeneous intercluster medium. It has been suggested that such a gas is the prime contributor to the X-ray background at > 10 keV; even if it is not, the observed strength of this background constrains the density and thermal history of any such gas. More gas can be ‘hidden’ in intergalactic space if it is ultra-hot (~ 40 keV) rather than at a lower temperature. Indeed, there could be almost enough such gas to provide the critical density if it were heated up at a redshift z < 3. The difficulties with this idea stem from the very large energy input and special thermal history necessary to avoid conflict with various observational constraints (Fabian & Kembhavi 1982)."[53]
Ultraviolets
In the figure at right, CUVOB stands for the cosmic ultraviolet and optical background.
"The first spectroscopic measurement of the diffuse cosmic ultraviolet background in the range 1700-2850 Å has resulted in the detection at high Galactic latitude of an intensity of 300 ± 100 photons (cm2 s sr Å)-1 at 1800 Å without any correction necessary for starlight or airglow, a similar intensity over the range 1900-2500 Å after correction for measured airglow, and a similar intensity over the range 2500-2800 Å after correction for zodiacal light."[54]
"What about radiation pressure? The microwave background is of course the dominant energy density. However, it is too weakly coupled (via Thomson scattering) to exert any effective damping on non-Hubble flows at epochs z ≲ 100. A somewhat more hopeful possibility is the pressure of Lyman line radiation. If the protogalactic gas is not completely ionized, most of the cosmic background emitted in the ultraviolet would have been transformed into Lyman alpha, whose energy density could exceed 100 eV per ion. The cross-section is certainly large enough to ensure that radiation has a short mean free path. However, in a collapsing (or expanding) medium, the photons would be shifted out of the line wings after the density has changed by a fraction (~ 3Δν/ν). Even though the line width may be as much as 50 Å, this means that the effectively trapped energy density at any instant would be only a tenth of the total radiation background density in the ultraviolet."[53]
Opticals
An "early XRB does not create significant amounts of new molecular hydrogen in the IGM, despite the increased population of free electrons. This is primarily due to the strong photo-destruction of H− and H2 by the near IR/optical (henceforth IR/O) and the far-UV (UV photons in the Lyman-Werner bands; henceforth FUV) backgrounds, in the respective energy ranges 0.755–11.2 eV and 11.2–13.6 eV, associated with any XRB generated by QSOs."[23]
The "minimum IR/O and FUV backgrounds associated with any putative XRB from high-z quasars more than compensate for any positive feedback from the XRB in the form of an increased electron fraction in the IGM (see, however, Ricotti et al. (2001) on the positive feedback for H2 formation in the vicinity of individual ionization fronts generated by hard stellar spectra)."[23]
Visuals
"In astronomical CCD technology, background is usually referred to the overall optical "noise" of the system, that is, the incoming light on the CCD sensor in absence of light sources. This background can originate from electronic noise in the CCD, from not-well-masked lights nearby the telescope, and so on. An exposure on an empty patch of the sky is also called a background, and is the sum of the system background level plus the sky's one."[1]
"A background frame is often the first exposure in an astronomical observation with a CCD: the frame will then be subtracted from the actual observation result, leaving in theory only the incoming light from the astronomical object being observed."[1]
"[T]he observed radiation density (the sky brightness of extragalactic background light) can be independent of finiteness of the Universe."[55]
"In astronomy, background commonly refers to the incoming light from an apparently empty part of the night sky."[1]
"In astronomy, background noise ... is electromagnetic radiation from the sky with no discernible source."[56]
"Even if no visible astronomical objects are present in given part of the sky, there always is some low luminosity present, due mostly to light diffusion from the atmosphere (diffusion of both incoming light from nearby sources, and of man-made Earth sources like cities). In the visible band, luminosity level is around the 22nd magnitude per square-arcsecond: a very low level, but anyway well within the limits of the current generation of telescopes."[1]
"There are several sources which contribute to the brightness of the (night) sky. Some of these are instrumental, or due to the presence of the atmosphere (like the airglow), in the case of ground based instruments. Even if we able to minimize the effect of instrumental and atmospherical components (e.g. using a spacecraft), there are still several astrophysical components contributing to the sky background: these could be sets of point sources like faint asteroids, Galactic stars and far away galaxies, as well as diffuse sources like dust in the Solar System, in the Milky Way, and in the intergalactic space. The actual importance of a specific component depends mostly of the wavelength of the measurement. The uncertainty (or noise) of the measurements caused by the astrophysical components of the sky background is called confusion noise."[1]
"Visual snow is a transitory or persisting ... snow or television-like static in parts or the whole of [the] visual fields, especially against dark backgrounds. It is much like camera noise in low light conditions."[57] The visual frame at right shows an example of visual snow.
Violets
"Carbon stars are enormously fainter in the violet region than expected from appropriate blackbody spectra."[58]
"The spectra of six carbon stars increase in brightness shortward of 3900 Å, indicating that the violet opacity in these stars is dominated by C3, not SiC."[58]
Blues
"The light blue background is the dayglow emission (less than 1 kR) caused by the interaction between the photoelectrons generated by solar UV radiation and atmospheric molecules and atoms."[59] This background occurs when imaging an Earth aurora from space using ultraviolet astronomy at the VUV wavelengths (135.6 ± 1.5 nm and 149.3 ± 1.5 nm).
"Isophotes of [blue (395.0-485.0 nm)] background starlight brightness (integrated starlight, diffuse galactic light, cosmic light) have been constructed near the celestial [NCP and SCP], ecliptic [NEP and SEP], and galactic [NGP and SGP] poles from observations accumulated by the Pioneer 10 [and 11] imaging photopolarimeter from beyond the asteroid belt."[60]
"Diffuse galactic [blue] light refers to starlight scattered by interstellar grains. Integrated light from extragalactic sources is referred to as cosmic light."[60]
"Earth-based observers are limited in their perception of background starlight, due to the presence of airglow line and continuum emission, zodiacal light, and the effects of atmospheric extinction and scattering."[60]
Some of the blue background data were collected on September 30, 1973 (day/year 279/73).[60]
"To determine the brightnesses, isophotes were generated from six days of merged data, chosen to optimize sky coverage. The days used and their heliocentric distances in AU are: 354/72 (3.27), 149/73 (4.23), 237/73 (4.64), 279/73 (4.81), 21/74 (5.08), 68/74 (5.15)."[60]
Conversion of units over the Pioneer blue (B) bandpass is[60]

For example,
NCP  NEP
NEP  and NGP
  [60]
[60]
Whereas,
SCP  SEP
SEP  and SGP
  [60]
[60]
Cyans
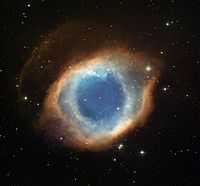
"ESO’s La Silla Observatory has snapped a new image [at right] of the famous Helix planetary nebula, revealing a rich — and rarely photographed — background of distant galaxies."[61]
"The Helix Nebula, NGC 7293, about 700 light-years away in the constellation of Aquarius, is a Sun-like star in its final explosion before retirement as a white dwarf."[61]
"The blue-green glow in the centre of the Helix comes from oxygen atoms shining under effects of the intense ultraviolet radiation of the 120 000 degree Celsius central star and the hot gas. Further out from the star and beyond the ring of knots, the red colour from hydrogen and nitrogen is more prominent."[61]
"Shells of gas are blown off from the surface of such stars, often in intricate and beautiful patterns, and shine under the harsh ultraviolet radiation from the faint, hot central star. The main ring of the Helix Nebula is about two light-years across, or half the distance between the Sun and its nearest stellar neighbour."[61]
"Despite being photographically spectacular, the Helix is hard to see visually as its light is thinly spread over a large area of sky."[61]
Greens
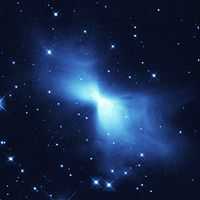
"The Boomerang Nebula is a young planetary nebula and the coldest object found in the Universe so far. The NASA/ESA Hubble Space Telescope image is yet another example of how Hubble's sharp eye reveals surprising details in celestial objects."[62]
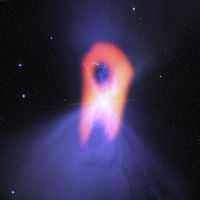
"NASA's Hubble Space Telescope caught the Boomerang Nebula [at second right] in images taken with the Advanced Camera for Surveys in early 2005. This reflecting cloud of dust and gas has two nearly symmetric lobes of matter that are being ejected from a central star. Each lobe of the nebula is nearly one light-year in length, making the total length of the nebula half as long as the distance from our Sun to our nearest neighbors- the Alpha Centauri stellar system, located roughly 4 light-years away. The Boomerang Nebula resides 5,000 light-years from Earth. Hubble's sharp view is able to resolve patterns and ripples in the nebula very close to the central star that are not visible from the ground."[63]
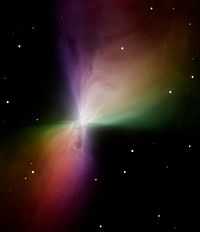
"This NASA/ESA Hubble Space Telescope image [at top right] shows a young planetary nebula known (rather curiously) as the Boomerang Nebula. It is in the constellation of Centaurus, 5000 light-years from Earth. Planetary nebulae form around a bright, central star when it expels gas in the last stages of its life."[62]
"The Boomerang Nebula is one of the Universe's peculiar places. In 1995, using the 15-metre Swedish ESO Submillimetre Telescope in Chile, astronomers Sahai and Nyman revealed that it is the coldest place in the Universe found so far. With a temperature of -272C, it is only 1 degree warmer than absolute zero (the lowest limit for all temperatures). Even the -270C background glow from the Big Bang is warmer than this nebula. It is the only object found so far that has a temperature lower than the background radiation."[62]
"The Hubble telescope took this image in 1998. It shows faint arcs and ghostly filaments embedded within the diffuse gas of the nebula's smooth 'bow tie' lobes. The diffuse bow-tie shape of this nebula makes it quite different from other observed planetary nebulae, which normally have lobes that look more like 'bubbles' blown in the gas. However, the Boomerang Nebula is so young that it may not have had time to develop these structures. Why planetary nebulae have so many different shapes is still a mystery."[62]
"The general bow-tie shape of the Boomerang appears to have been created by a very fierce 500 000 kilometre-per-hour wind blowing ultracold gas away from the dying central star. The star has been losing as much as one-thousandth of a solar mass of material per year for 1500 years. This is 10-100 times more than in other similar objects. The rapid expansion of the nebula has enabled it to become the coldest known region in the Universe."[62]
"The image was exposed for 1000 seconds through a green-yellow filter. The light in the image comes from starlight from the central star reflected by dust particles."[62] The image pixels have been coded blue even though the filter is centered at 606 nm.
"The Boomerang nebula, called the "coldest place in the universe," reveals its true shape to the Atacama Large Millimeter/submillimeter Array (ALMA) telescope. The background blue structure, as seen in visible light by NASA's Hubble Space Telescope, shows a classic double-lobe shape with a very narrow central region. ALMA’s resolution and ability to see the cold gas molecules reveals the nebula’s more elongated shape, as seen in red."[64]
"The sky background depends strongly on the color filters used. For a dark night, it is smallest, around 20 electrons/pixel/140 seconds with the U filter, and largest, around 600 electrons/pixel/140 seconds with the R filter."[65]
"[H]igh-resolution (0.1") observations of the Seyfert 2 galaxy NGC 5728 with the Hubble Space Telescope [have produced images in the] green and red continua."[66]
"[E]xposures were taken through the F492M filter (4906 Å/364 Å) to cover the [O III] λλ4959, 5007 emission. A single exposure was taken through each of the filters F547M (5454 Å/438 Å) and F718M (7160 Å/595 Å) to record the off-band continua."[66]
Reds
"[T]he instrumental response, sky background, and seeing conspire to provide the best images. All the available bands are used to define colors with which we separate cluster members from the background in order to minimize dilution of the weak-lensing signal by unlensed objects."[67]
"We select red galaxies with colors redder than the color-magnitude sequence of cluster E/SO galaxies. The sequence forms a well-defined line due to the richness and relatively low redshifts of our clusters. These red galaxies are expected to lie in the background by virtue of k-corrections which are greater than for the red cluster sequence galaxies".[67]
"Typically the proportion of blue galaxies used is around 50% of the red background."[67]
"[T]he gravitational shear field [is derived] by locally averaging the corrected distortions of color-selected background galaxies of each cluster. ... Maps of the surface number-density distribution of color-selected cluster member galaxies [have been produced], with the gravitational shear of background galaxies overlaid ... Profiles of background red galaxy counts, whose intrinsic slope is relatively shallow [have been observed] ... the utility of the background red galaxies for measuring magnification [has been established]."[67]
"The distortion profiles measured are among the most accurate constructed to date and the great depth of the Subaru imaging permits magnification profiles to be established with unprecedented detail using the background red galaxy counts."[67]
Infrareds
The diffuse infrared background has been surveyed by the Diffuse Infrared Background Experiment (DIRBE) aboard NASA's Cosmic Background Explorer (COBE).[68] "The DIRBE instrument was an absolute radiometer with an off-axis folded-Gregorian reflecting telescope, with 19 cm diameter aperture.[68]"[69] "[B]rightness maps of the universe at ten frequency bands ranging from the near to far infrared (1.25 to 240 micrometer) [have been obtained].[68] Also, linear polarization was measured at 1.25, 2.2, and 3.5 micrometers.[68] During the mission, the instrument could sample half the celestial sphere each day.[68]"[69]
"DIRBE also detected 10 new far-IR emitting galaxies in the region not surveyed by IRAS as well as nine other candidates in the weak far-IR that may be spiral galaxies. Galaxies that were detected at the 140 and 240 μm were also able to provide information on very cold dust (VCD). At these wavelengths, the mass and temperature of VCD can be derived."[70]
"When these data were joined with 60 and 100 μm data taken from IRAS, it was found that the far-infrared luminosity arises from cold (≈17–22 K) dust associated with diffuse HI cirrus clouds, 15-30% from cold (≈19 K) dust associated with molecular gas, and less than 10% from warm (≈29 K) dust in the extended low-density HII regions.[71]"[70]
Submillimeters
“The Balloon-borne Large Aperture Submillimeter Telescope (BLAST) is a submillimeter telescope that hangs from a high altitude balloon. It has a 2 meter primary mirror that directs light into bolometer arrays operating at 250, 350, and 500 µm. ... BLAST's primary science goals are:[72]
- Measure photometric redshifts, rest-frame [Far infrared] FIR luminosities and star formation rates of high-redshift starburst galaxies, thereby constraining the evolutionary history of those galaxies that produce the FIR/submillimeter background.
- Measure cold pre-stellar sources associated with the earliest stages of star and planet formation.
- Make high-resolution maps of diffuse galactic emission over a wide range of galactic latitudes.”[73]
"The differential 850-μm counts are well described by the function
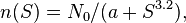
where  is the flux in mJy,
  = 3.0 × 10⁴ per square degree per mJy, and
  = 0.4 − 1.0 is chosen to match the 850-μm extragalactic background light."[74]
The "absorption and reradiation of light by dust in the history of galaxy formation and evolution is [...] the submillimeter extragalactic background light [(EBL). It] has approximately the same integrated energy density as the optical EBL."[74]
Microwaves
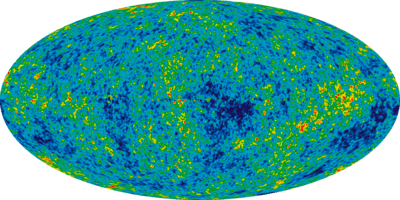
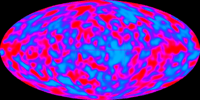
Compare the COBE all-sky CMB at right with the map from WMAP in the center.
"The cosmic microwave background fluctuations are extremely faint, only one part in 100,000 compared to the 2.73 degree Kelvin average temperature of the radiation field."[75]
"[B]ackground radiation may simply be any radiation that is pervasive, whether ionizing or not. A particular example of this is the cosmic microwave background radiation, a nearly uniform glow that fills the sky in the microwave part of the spectrum; stars, galaxies and other objects of interest in radio astronomy stand out against this background."[76]
The image at the top shows the "detailed, all-sky picture of the infant universe created from nine years of WMAP data. The image reveals 13.77 billion year old temperature fluctuations (shown as color differences) that correspond to the seeds that grew to become the galaxies. The signal from the our Galaxy was subtracted using the multi-frequency data. This image shows a temperature range of ± 200 microKelvin."[77]
"The existence of galaxies and clusters today requires that perturbations in the density must have become nonlinear before the present epoch. In a baryonic universe, for adiabatic perturbations at recombination, this implies present-day fluctuations in the microwave background an order of magnitude larger than the present observational upper limits of ~ 2 x 10⁻⁵ on scales of 2 arcmin (Uson & Wilkinson 1984)."[53]
"For nonbaryonic dark matter, on the other hand, the predicted fluctuations in the microwave background are consistent with the observations—though only if Ωh4/3 > 0.2 (Bond & Efstathiou 1984)—since the baryonic fluctuations are small at recombination and only later grow to the same size as fluctuations in the dark matter. [...] if the universe had inflated by just the amount needed to yield Ω of (say) 0.1, it would be unnatural to find such small amplitude anisotropies in the microwave background—this would require the pre-inflation geometry of our observable universe to have been rather special, with a curvature which was essentially constant (to 1 part in ~ 104) over scales of order the curvature radius."[53]
"Hogan (1984) points out that, if large volumes of gas were raised to such high temperatures that pressure gradients could drive the requisite motions, the Sunyaev-Zeldovich effect might lead to smallscale anisotropies in the microwave background exceeding the measured limits. But, despite this constraint, there may be no insurmountable objection to this general possibility; it is conceivable that the configurations we now see could be determined by gas-dynamical rather than primarily gravitational effects."[53]
Radios
The "NRAO Very Large Array (VLA; program AR677) [has been used] in the most extended A configuration on 2008 September 28 to find background extragalactic sources as position references near the target H2O maser sources."[79]
We "selected unresolved sources in the NRAO VLA Sky Survey (NVSS) catalog within ≈ 2°of each maser target and observed both background candidates and target masers at 8 and 22 GHz. For W51 Main/South, we found one new background source J1922+1504 for VLBA observations in addition to two known calibrators from the VLBA Calibrator Survey-1 (VCS1; Beasley et al. 2002), J1922+1530 and J1924+1540. However, at 0.3 mas resolution of the VLBA, we found the new source J1922+1504 displayed a resolved structure and was not useful for parallax measurements"[79]
"Using a four-block setup allows the middle block of observing time to be available for phase-referencing rapid-switching scans between the target maser and background continuum sources when the source elevation was the highest at most stations. We measured multi-band delays and fringe rates, mostly due to un-modeled atmospheric propagation delays, to determine zenith delay errors as a function of time for each antenna."[79]
“[C]osmic microwave background (CMB) radiation (also CMBR, CBR, MBR, and relic radiation) is thermal radiation filling the observable universe almost uniformly.[80]”[81]
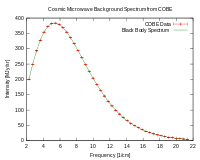
“Precise measurements of cosmic background radiation are critical to cosmology, since any proposed model of the universe must explain this radiation. The CMBR has a thermal black body spectrum at a temperature of 2.725 K,[82] which peaks at the microwave range frequency of 160.2 GHz, corresponding to a 1.873 mm wavelength. This holds if measured per unit frequency, as in Planck's law. If measured instead per unit wavelength, using Wien's law, the peak is at 1.06 mm corresponding to a frequency of 283 GHz.”[81]
"The differential 850-μm counts are well described by the function
where is the flux in mJy, = 3.0 × 10⁴ per square degree per mJy, and = 0.4 − 1.0 is chosen to match the 850-μm extragalactic background light."[74]
Gaseous objects
"Proton–hydrogen charge-exchange collisions [such as those shown at right] are often the most important process in space plasma because [h]ydrogen is the most abundant constituent of both plasmas and background gases and hydrogen charge-exchange occurs at very high velocities involving little exchange of momentum."[83]
Rocky objects
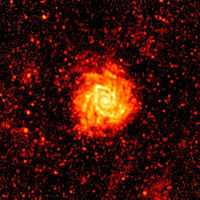
"On 24 June 2009, SPIRE recorded its first images during the in-orbit commissioning phase of the Herschel mission. This picture, made before fine-tuning or in-orbit final calibration was performed, shows a SPIRE image of the galaxy M74 at a wavelength of 250 microns. The image traces emission by dust in clouds where star formation are active, and the nucleus and spiral arms show up clearly. Dust is part of the interstellar material fuelling star formation, and this image effectively shows the reservoirs of gas and dust that are available to be turned into stars in the galaxy. Significantly, the image frame is also filled with many other galaxies which are much more distant and only show up as point sources. There are also some extended structures, possibly due to clouds of dust in our own galaxy."[84]
"M74 (also known as NGC 628) is a face-on spiral galaxy located about 24 million light-years from Earth in the constellation Pisces. Visible light, produced mainly by the stars within the galaxy, reveals a bright nucleus and well-defined spiral arms that contain many small, bright regions where young massive stars have formed recently. The submillimetre SPIRE image traces the cold dust between the stars, and the spiral arms appear much more enhanced. This galaxy also contains many faint dots that are actually distant galaxies in the background and dust radiating at submillimetre wavelengths but are too distant for the structure in the galaxies to be resolved."[84]
Oxygens
"[A]irglow emissions [have been] measured by using vertical-viewing photometers [for the] O(1S) green line at 557.7 nm [with a] background at 566 nm"[85].
Mars
"Phoenix touched down on the Red Planet at 4:53 p.m. Pacific Time (7:53 p.m. Eastern Time), May 25, 2008, in an arctic region called Vastitas Borealis, at 68 degrees north latitude, 234 degrees east longitude."[86]
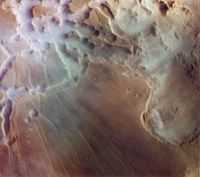
"As the sun rises over Noctis Labyrinthus (the labyrinth of the night), bright clouds of water ice can be observed in and around the tributary canyons of this high plateau region of Mars. This color composite image, reconstructed through violet, green, and orange filters, vividly shows the distribution of clouds against the rust colored background of this Martian desert."[87]
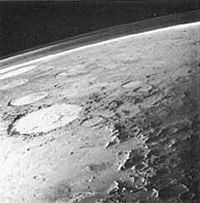
At lower right is a view of the Martian atmosphere and surface taken through the Viking Orbiter violet filter to illustrate the dramatic clarity "of the atmosphere in the region east and northeast of the Argyre basin during winter in the southern hemisphere. [The image is] taken just after the winter solstice when solar heating is minimal."[88]
Molecular clouds
"Using the Submillimeter Array, a set of eight radiotelescopes atop Mauna Kea in Hawaii, [it was] found that G0.253+0.016 possesses very few ultra-dense nuggets that could collapse to form stars."[89]
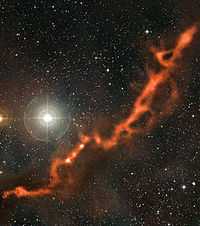
"This image [at right] from the APEX telescope, of part of the Taurus Molecular Cloud, shows a sinuous filament of cosmic dust more than ten light-years long. In it, newborn stars are hidden, and dense clouds of gas are on the verge of collapsing to form yet more stars. The cosmic dust grains are so cold that observations at submillimetre wavelengths, such as these made by the LABOCA camera on APEX, are needed to detect their faint glow. This image shows two regions in the cloud: the upper-right part of the filament shown here is Barnard 211, while the lower-left part is Barnard 213."[90]
"The submillimetre-wavelength observations from the LABOCA camera on APEX, which reveal the heat glow of the cosmic dust grains, are shown here in orange tones. They are superimposed on a visible-light image of the region, which shows the rich background of stars. The bright star above the filament is φ Tauri."[90]
Dark nebulae
"The 111 → 110 rotational transition of formaldehyde (H2CO) [occurs] in absorption in the direction of four dark nebulae. The radiation ... being absorbed appears to be the isotropic microwave background".[91] One of the dark nebulae sampled, per SIMBAD is TGU H1211 P5.
Giant molecular clouds
"A vast assemblage of molecular gas with a mass of approximately 103–107 times the mass of the Sun[92] is called a giant molecular cloud (GMC). GMCs are ≈15–600 light-years in diameter (5–200 parsecs).[92] Whereas the average density in the solar vicinity is one particle per cubic centimetre, the average density of a GMC is 102–103 particles per cubic centimetre. Although the Sun is much denser than a GMC, the volume of a GMC is so great that it contains much more mass than the Sun. The substructure of a GMC is a complex pattern of filaments, sheets, bubbles, and irregular clumps.[93]"[94]
"The densest parts of the filaments and clumps are called "molecular cores", whilst the densest molecular cores are, unsurprisingly, called "dense molecular cores" and have densities in excess of 104–106 particles per cubic centimeter. Observationally molecular cores are traced with carbon monoxide and dense cores are traced with ammonia. The concentration of dust within molecular cores is normally sufficient to block light from background stars so that they appear in silhouette as dark nebulae.[95]"[94]
"GMCs are so large that "local" ones can cover a significant fraction of a constellation; thus they are often referred to by the name of that constellation, e.g. the Orion Molecular Cloud (OMC) or the Taurus Molecular Cloud (TMC). These local GMCs are arrayed in a ring in the neighborhood of the Sun coinciding with the Gould Belt.[96] The most massive collection of molecular clouds in the galaxy forms an asymmetrical ring around the galactic center at a radius of 120 parsecs; the largest component of this ring is the Sagittarius B2 complex. The Sagittarius region is chemically rich and is often used as an exemplar by astronomers searching for new molecules in interstellar space.[97]"[94]
Stars
"We do believe that unresolved background stars explain the occasional cases where different colors predict very different temperatures. ... A significant contribution from background stars would in general combine light from stars with different temperatures."[98]
"Do we know enough about the intergalactic medium to trust measurements of background sources seen through foreground structure?"[19]
Messier 17
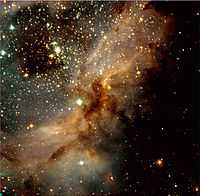
At right "is a near-infrared, colour-coded composite image of a sky field in the south-western part of the galactic star-forming region Messier 17. In this image, young and heavily obscured stars are recognized by their red colour. Bluer objects are either foreground stars or well-developed massive stars whose intense light ionizes the hydrogen in this region. The diffuse light that is visible nearly everywhere in the photo is due to emission from hydrogen atoms that have (re-)combined from protons and electrons. The dark areas are due to obscuration of the light from background objects by large amounts of dust — this effect also causes many of those stars to appear quite red. A cluster of young stars in the upper-left part of the photo, so deeply embedded in the nebula that it is invisible in optical light, is well visible in this infrared image. Technical information : The exposures were made through three filtres, J (at wavelength 1.25 µm; exposure time 5 min; here rendered as blue), H (1.65 µm; 5 min; green) and Ks (2.2 µm; 5 min; red); an additional 15 min was spent on separate sky frames. The seeing was 0.5 - 0.6 arcsec. The objects in the uppermost left corner area appear somewhat elongated because of a colour-dependent aberration introduced at the edge by the large-field optics. The sky field shown measures approx. 5 x 5 arcmin 2 (corresponding to about 3% of the full moon). North is up and East is left."[99]
Star-forming regions
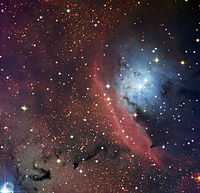
"The gas in the clouds of NGC 6559, mainly hydrogen, is the raw material for star formation ... When a region inside this nebula gathers enough matter, it starts to collapse under its own gravity. The center of the cloud grows ever denser and hotter, until thermonuclear fusion begins and a star is born. The hydrogen atoms combine to form helium atoms, releasing energy that makes the star shine. ... In regions where it is very dense, the dust completely blocks the light behind it, as is the case for the dark isolated patches and sinuous lanes to the bottom left-hand side and right-hand side of the image".[100]
"The Danish 1.54-metre telescope located at ESO’s La Silla Observatory in Chile has captured a striking image of NGC 6559, an object that showcases the anarchy that reigns when stars form inside an interstellar cloud. This region of sky includes glowing red clouds of mostly hydrogen gas, blue regions where starlight is being reflected from tiny particles of dust and also dark regions where the dust is thick and opaque."[101]
"The two colors of the cloud represent a pair of nebulas. Once the young stars are born, they "energize" the hydrogen surrounding them, ESO officials said. The gas then creates the red wispy cloud — known to astronomers as an "emission nebula" — in the center of the image."[102]
"These young stars are usually of spectral type O and B, with temperatures between 10 000 and 60 000 K, which radiate huge amounts of high energy ultraviolet light that ionises the hydrogen atoms."[103]
"The blue section of the photo — representing a "reflection nebula" — shows light from the newly formed stars in the cosmic nursery being reflected in all directions by the particles of dust made of iron, carbon, silicon and other elements in the interstellar cloud."[102]
"NGC 6559 is planetary nebula located at a distance of about 5000 light-years from Earth, in the constellation of Sagittarius."[104]
"NGC 6559 is a cloud of gas and dust located at a distance of about 5000 light-years from Earth, in the constellation of Sagittarius (The Archer). The glowing region is a relatively small object, just a few light-years across, in contrast to the one hundred light-years and more spanned by its famous neighbour, the Lagoon Nebula (Messier 8, eso0936). Although it is usually overlooked in favour of its distinguished companion, NGC 6559 has the leading role in this new picture."[103]
"The Milky Way fills the background of the image with countless yellowish older stars. Some of them appear fainter and redder because of the dust in NGC 6559."[103]
"This eye-catching image of star formation was captured by the Danish Faint Object Spectrograph and Camera (DFOSC)".[103]
Geography
For possibly locating X-ray sources above the Earth's atmosphere, there are a number of reasons to consider probing from different geographical locations:
- early visual observations of the solar corona are associated with eclipses of the Sun by the Moon,
- if the Sun is an X-ray source, then perhaps other stars are, and only so many can be observed from one location,
- laboratory measurements use a peak of intensity to background (possible unknown sources) technique which demands measuring an X-ray background noise, and
- there may be X-ray scattering by the Earth's upper atmosphere.
Cosmogony
"Although we cannot confidently predict what these so-called ‘population ΙΙI’ stars would be like (Kashlinsky & Rees 1983), there are several constraints which, in combination, imply that if there are enough of them to provide the unseen mass, the individual masses must either be less than 0.1 M⊙ or else in the range 103–106 Μ⊙. Masses above ~ 0.1 M⊙ would contribute too much background light unless they had all evolved and died, leaving dark remnants. But the remnants of ordinary massive stars of 10–100 M⊙ would produce too much material in the form of heavy elements."[53]
Technology
"[N]oise is a random fluctuation in an electrical signal, a characteristic of all electronic circuits.[105] Noise generated by electronic devices varies greatly, as it can be produced by several different effects. Thermal noise is unavoidable at non-zero temperature (see fluctuation-dissipation theorem), while other types depend mostly on device type (such as shot noise,[105][106] which needs steep potential barrier) or manufacturing quality and semiconductor defects, such as conductance fluctuations, including 1/f noise."[107]
"[N]oise is an error or undesired random disturbance of a useful information signal, introduced before or after the detector and decoder. The noise is a summation of unwanted or disturbing energy from natural and sometimes man-made sources. Noise is, however, typically distinguished from interference, (e.g. cross-talk, deliberate jamming or other unwanted electromagnetic interference from specific transmitters), for example in the signal-to-noise ratio (SNR), signal-to-interference ratio (SIR) and signal-to-noise plus interference ratio (SNIR) measures. Noise is also typically distinguished from distortion, which is an unwanted alteration of the signal waveform, for example in the signal-to-noise and distortion ratio (SINAD). In a carrier-modulated passband analog communication system, a certain carrier-to-noise ratio (CNR) at the radio receiver input would result in a certain signal-to-noise ratio in the detected message signal. In a digital communications system, a certain Eb/N0 (normalized signal-to-noise ratio) would result in a certain bit error rate (BER)."[107]
"[S]pikes are fast, short duration electrical transients in voltage (voltage spikes), current (current spikes), or transferred energy (energy spikes) in an electrical circuit."[108]
"Fast, short duration electrical transients (overvoltages) in the electric potential of a circuit are typically caused by"[108]
- Lightning strikes,
- Power outages,
- Tripped circuit breakers,
- Short circuits,
- Power transitions in other large equipment on the same power line,
- Malfunctions caused by the power company,
- Electromagnetic pulses (EMP) with electromagnetic energy distributed typically up to the 100 kHz and 1 MHz frequency range, or
- Inductive spikes.
"For sensitive electronics, excessive current can flow if this voltage spike exceeds a material's breakdown voltage, or if it causes avalanche breakdown. In semiconductor junctions, excessive electric current may destroy or severely weaken that device. An avalanche diode, transient voltage suppression diode, transil, varistor, overvoltage crowbar, or a range of other overvoltage protective devices can divert (shunt) this transient current thereby minimizing voltage.[109]"[108]
Satellites
"The first gamma-ray telescope carried into orbit, on the Explorer 11 satellite in 1961, picked up fewer than 100 cosmic gamma-ray photons. They appeared to come from all directions in the Universe, implying some sort of uniform "gamma-ray background". Such a background would be expected from the interaction of cosmic rays (very energetic charged particles in space) with interstellar gas."[28]
Galileo Orbiter
The Energetic Particles Detector (EPD) aboard the Galileo Orbiter is "designed to measure the numbers and energies of ... electrons whose energies exceed about 20 keV ... The EPD [can] also measure the direction of travel of [electrons] ... The EPD [uses] silicon solid state detectors and a time-of-flight detector system to measure changes in the energetic [electron] population at Jupiter as a function of position and time."[110]
"[The] two bi-directional, solid-state detector telescopes [are] mounted on a platform which [is] rotated by a stepper motor into one of eight positions. This rotation of the platform, combined with the spinning of the orbiter in a plane perpendicular to the platform rotation, [permits] a 4-pi [or 4π] steradian coverage of incoming [electrons]. The forward (0 degree) ends of the two telescopes [have] an unobstructed view over the [4π] sphere or [can] be positioned behind a shield which not only [prevents] the entrance of incoming radiation, but [contains] a source, thus allowing background corrections and in-flight calibrations to be made. ... The 0 degree end of the [Low-Energy Magnetospheric Measurements System] LEMMS [uses] magnetic deflection to separate incoming electrons and ions. The 180 degree end [uses] absorbers in combination with the detectors to provide measurements of higher-energy electrons ... The LEMMS [provides] measurements of electrons from 15 keV to greater than 11 MeV ... in 32 rate channels."[111]
The E and B experiment
"The E and B Experiment (EBEX) will measure the cosmic microwave background radiation of a part of the sky during two sub-orbital (high altitude) balloon flights. It is an experiment to make large, high-fidelity images of the CMB polarization anisotropies. By using a telescope which flies at over 42,000 metres high, it is possible to reduce the atmospheric absorption of microwaves to a minimum. This allows massive cost reduction compared to a satellite probe, though only a small part of the sky can be scanned and for shorter duration than a typical satellite mission such as WMAP."[112]
"EBEX was launched on 29 December, 2012, near McMurdo Station in Antarctica.[113][114]"[112]
"EBEX is meant to hone in on one specific feature of the CMB light that's been predicted, but never seen — a signature called B-type polarization, thought to have been produced by the gravity waves created by the universe's extremely rapid infant expansion, which happened even before the CMB light was released."[115]
Balloons
“The Balloon-borne Large Aperture Submillimeter Telescope (BLAST) is a submillimeter telescope that hangs from a high altitude balloon. It has a 2 meter primary mirror that directs light into bolometer arrays operating at 250, 350, and 500 µm. ... BLAST's primary science goals are:[116]
- Measure photometric redshifts, rest-frame FIR luminosities and star formation rates of high-redshift starburst galaxies, thereby constraining the evolutionary history of those galaxies that produce the FIR/submillimeter background.
- Measure cold pre-stellar sources associated with the earliest stages of star and planet formation.
- Make high-resolution maps of diffuse galactic emission over a wide range of galactic latitudes.”[73]
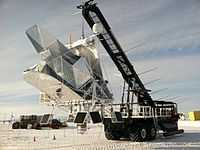
“High-altitude balloons and aircraft ... can get above [much] of the atmosphere. The BLAST experiment and SOFIA are two examples, respectively, although SOFIA can also handle near infrared observations.”[117]
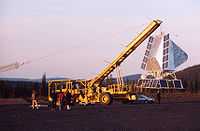
At left above "NASA's balloon-carried BLAST sub-millimeter telescope is hoisted into launch position on Dec. 25, 2012, at McMurdo Station in Antarctica on a mission to peer into the cosmos."[118] The giant helium-filled balloon is slowly drifting about 36 km above Antarctica. It was "[l]aunched on Tuesday (Dec. 25) from the National Science Foundation's Long Duration Balloon (LDB) facility ... This is the fifth and final mission for BLAST, short for the Balloon-borne Large-Aperture Submillimeter Telescope. ... "BLAST found lots of so-called dark cores in our own Milky Way — dense clouds of cold dust that are supposed to be stars-in-the-making. Based on the number of dark cores, you would expect our galaxy to spawn dozens of new stars each year on average. Yet, the galactic star formation rate is only some four solar masses per year." So why is the stellar birth rate in our Milky Way so low? Astronomers can think of two ways in which a dense cloud of dust is prevented from further contracting into a star: turbulence in the dust, or the collapse-impeding effects of magnetic fields. On its new mission, BLAST should find out which process is to blame. ... [The 1800-kilogram] stratospheric telescope will observe selected star-forming regions in the constellations Vela and Lupus."[119]
Original research
- See also: Original research inquiry and Research
Hypothesis:
- Determining the background for a given measurement may involve bands, scatter, and secondary effects.
- See also: Control groups, Proof of concept, and Proof of technology
See also
- Band astronomy
- Continua astronomy
- Intensity astronomy
References
- 1 2 3 4 5 6 "Background (astronomy), In: Wikipedia". San Francisco, California: Wikimedia Foundation, Inc. October 7, 2010. Retrieved 2013-07-04.
- 1 2 Domínguez et al. 2011, MNRAS, 410, 2556
- 1 2 "Extragalactic background light, In: Wikipedia". San Francisco, California: Wikimedia Foundation, Inc. March 15, 2013. Retrieved 2013-05-03.
- ↑ Primack J. R., Bullock J. S., Somerville R. S., MacMinn D., 1999, APh, 11, 93
- ↑ Somerville R. S., Gilmore R. C., Primack J. R., Domínguez A., 2012, arXiv:1104.0669
- ↑ Gilmore R. C., Somerville R. S., Primack J. R., Domínguez A., 2012, arXiv:1104.0671
- ↑ Malkan M. A., Stecker F. W., 1998, ApJ, 496, 13
- ↑ Stecker F. W., Malkan M. A., Scully S. T., 2006, ApJ, 648, 774
- ↑ Franceschini A., Rodighiero G., Vaccari M., 2008, A&A, 487, 837
- ↑ Kneiske T. M., Mannheim K., Hartmann D. H., 2002, A&A, 386, 1
- ↑ Finke J. D., Razzaque S., Dermer C. D., 2010, ApJ, 712, 238
- ↑ Kneiske T.~M., Dole H., 2010, A&A, 515, A19
- ↑ M. A. Gordon (August 1, 1988). "The continuum spectra of warm cloud complexes associated with radio-bright H II regions". The Astrophysical Journal 331 (08): 509-22. doi:10.1086/166576. http://adsabs.harvard.edu/full/1988ApJ...331..509G. Retrieved 2013-10-20.
- ↑ Alexandre Amblard (February 16, 2011). "Herschel Measures Dark Matter Required For Star-Forming Galaxies". Pasadena, California USA: Caltech. Retrieved 2014-03-15.
- 1 2 Asantha Cooray (February 16, 2011). "Herschel Measures Dark Matter Required For Star-Forming Galaxies". Pasadena, California USA: Caltech. Retrieved 2014-03-15.
- 1 2 William Danchi (February 16, 2011). "Herschel Measures Dark Matter Required For Star-Forming Galaxies". Pasadena, California USA: Caltech. Retrieved 2014-03-15.
- 1 2 Jamie Bock (February 16, 2011). "Herschel Measures Dark Matter Required For Star-Forming Galaxies". Pasadena, California USA: Caltech. Retrieved 2014-03-15.
- ↑ Jamie Bock (February 16, 2011). "Herschel's View of 'Lockman Hole'". Pasadena, California USA: Caltech. Retrieved 2014-03-15.
- 1 2 Ryan Scranton, Andreas Albrecht, Robert Caldwell, Asantha Cooray, Olivier Dore, Salman Habib, Alan Heavens, Katrin Heitmann, Bhuvnesh Jain, Lloyd Knox, Jeffrey A. Newman, Paolo Serra, Yong-Seon Song, Michael Strauss, Tony Tyson, Licia Verde, Hu Zhan (2009). "The Case for Deep, Wide-Field Cosmology, In: Astro2010: The Astronomy and Astrophysics Decadal Survey, Science White Papers" (269). arXiv:0902.2590. Bibcode:2009astro2010S.269S. Retrieved 2013-07-16.
- ↑ Hauser M. G., Dwek E., 2001, Annual Review of Astronomy and Astrophysics, 39, 249
- 1 2 "Diffuse extragalactic background radiation, In: Wikipedia". San Francisco, California: Wikimedia Foundation, Inc. February 15, 2012. Retrieved 2012-12-24.
- ↑ MP Ulmer (January 26, 2009). Manijeh Razeghi; Rengarajan Sudharsanan; Gail J. Brown. ed. A review of UV detectors for astrophysics: past, present, and future, In: Quantum Sensing and Nanophotonic Devices VI. 7222. The International Society for Optical Engineering. doi:10.1117/12.810039. http://proceedings.spiedigitallibrary.org/proceeding.aspx?articleid=1334238. Retrieved 2014-02-09.
- 1 2 3 Aparna Venkatesan, Mark L. Giroux and J. Michael Shull (December 10, 2001). "Heating and ionization of the intergalactic medium by an early X-ray background". The Astrophysical Journal 563 (1): 1-9. doi:10.1086/323691. http://iopscience.iop.org/0004-637X/563/1/1. Retrieved 2014-02-10.
- ↑ http://www.flickr.com/photos/gsfc/5161800891/sizes/l/in/photostream/
- ↑ "Giant Gamma-ray Bubbles Found Around Milky Way". Retrieved 2010-11-14.
- ↑ Wiley (December 2010). "News and Views: Pierre Auger Observatory: an interdisciplinary opportunity; Surprise found in Fermi data; Double-blind refereeing: does the RAS need it?". Astronomy & Geophysics 51 (6): 6.06-6.06. doi:10.1111/j.1468-4004.2010.51604_10.x.
- ↑ "Why is the Milky Way Blowing Bubbles?". SKY and Telescope. Retrieved 2010-11-14.
- 1 2 "Gamma-ray astronomy, In: Wikipedia". San Francisco, California: Wikimedia Foundation, Inc. May 15, 2012. Retrieved 2012-06-10.
- ↑ "Milky Way, In: Wikipedia". San Francisco, California: Wikimedia Foundation, Inc. June 5, 2012. Retrieved 2012-06-10.
- 1 2 3 4 5 6 P. Buford Price and the Amanda Collaboration (September 8, 2005). "AMANDA-II Science Results". Irvine, California USA: University of California Irvine. Retrieved 2014-03-23.
- ↑ "Neutron detection, In: Wikipedia". San Francisco, California: Wikimedia Foundation, Inc. March 17, 2013. Retrieved 2013-05-22.
- 1 2 3 4 5 6 Y. Muraki, K. Murakami, M. Miyazaki, K. Mitsui. S. Shibata, S. Sakakibara, T. Sakai, T. Takahashi, T. Yamada, and K. Yamaguchi (December 1, 1992). "Observation of solar neutrons associated with the large flare on 1991 June 4". The Astrophysical Journal 400 (2): L75-8. http://adsabs.harvard.edu/full/1992ApJ...400L..75M. Retrieved 2013-12-07.
- 1 2 "Cosmic infrared background, In: Wikipedia". San Francisco, California: Wikimedia Foundation, Inc. June 8, 2012. Retrieved 2012-09-01.
- ↑ G. Barbiellini, G. Basini, R. Bellotti, M. Bpcciolini, M. Boezio, F. Massimo Brancaccio, U. Bravar, F. Cafagna, M. Candusso, P. Carlson, M. Casolino, M. Castellano, M. Circella, A. Codino, G. De Cataldo, C. De Marzo, M.P. De Pascale, N. Finetti, T. Francke, N. Giglietto, R.L. Golden, C. Grimani, M. Hof, B. Marangelli, W. Menn, J.W. Mitchell, A. Morselli, J.F. Ormes, P. Papini, a. Perego, S. Piccardi, P. Picozza, M. Ricci, P. Schiavon, M. Simon, R. Sparvoli, P. Spillatini, P. Spinelli, S.A. Stephens, S.J. Stochaj, R.E. Streitmatter, M. Suffert, A. Vacchi, N. Weber, and N. Zampa (May 1996). "The cosmic-ray positron-to-electron ratio in the energy range 0.85 to 14 GeV". Astronomy and Astrophysics 309 (05): L15-8. http://adsabs.harvard.edu/abs/1996A&A...309L..15B. Retrieved 2013-08-11.
- ↑ On the morphology of the electron-positron annihilation emission as seen by SPI/INTEGRAL (September 10, 2010). "L. Bouchet, J. P. Roques, and E. Jourdain". The Astrophysical Journal 720 (2): 1772-80. doi:10.1088/0004-637X/720/2/1772. http://iopscience.iop.org/0004-637X/720/2/1772. Retrieved 2013-08-16.
- ↑ M. Altmaier and U. Herpers (September 2001). "Al-26 in 34 Stony Meteorites Measured via Gamma-gamma Coincidence Counting". Meteoritics & Planetary Science Supplement 36 (09): A10. http://adsabs.harvard.edu/full/2001M%26PSA..36R..10A. Retrieved 2013-08-11.
- ↑ Thomas K. Gaisser (1990). Cosmic Rays and Particle Physics. Cambridge University Press. pp. 279. ISBN 0521339316. http://books.google.com/books?hl=en&lr=&id=qJ7Z6oIMqeUC&oi=fnd&pg=PR15&ots=IxjwLxBwXu&sig=voHKIYstBlBYla4jcbur_b-Zwxs. Retrieved 2014-01-11.
- ↑ Steve Kliewer (1997). "Muons". Berkeley, California USA: Lawrence Berkeley Laboratory. Retrieved 2014-03-21.
- ↑ Timothy Oleson (January 1, 2012). "Astronomy under the ice: Scientists use Antarctic ice to study some of the tiniest particles in the cosmos". American Geosciences Institute. Retrieved 2014-03-21.
- 1 2 KENNETH CHANG (April 26, 2005). "Tiny, Plentiful and Really Hard to Catch". The New York Times. Retrieved 2011-06-16.
- ↑ "Neutrino detector, In: Wikipedia". San Francisco, California: Wikimedia Foundation, Inc. May 23, 2012. Retrieved 2012-06-08.
- ↑ "Neutrino astronomy, In: Wikipedia". San Francisco, California: Wikimedia Foundation, Inc. March 5, 2012. Retrieved 2012-06-08.
- ↑ Christian Spiering (2013). "Towards High-Energy Neutrino Astronomy. A Historical Review". INSPIRE, the High Energy Physics information system. Retrieved 2014-03-21.
- ↑ "Gamma ray, In: Wikipedia". San Francisco, California: Wikimedia Foundation, Inc. August 25, 2012. Retrieved 2012-08-31.
- ↑ A. Elyiv, A. Neronov, D.V. Semikoz (2009). "Gamma-ray induced cascades and magnetic fields in intergalactic medium". Physical Review D 80 (2): 11. doi:10.1103/PhysRevD.80.023010. http://prd.aps.org/abstract/PRD/v80/i2/e023010. Retrieved 2014-02-12.
- 1 2 3 4 5 6 7 Günter Sigl, Sangjin Lee, and David N. Schramm (January 1997). "Cosmological Neutrino Signatures for Grand Unification Scale Physics". Physics Letters B 392 (1-2): 129-34. http://www.sciencedirect.com/science/article/pii/S0370269396015341. Retrieved 2014-02-07.
- ↑ NASA. "NASA’s Fermi Probes “Dragons” of the Gamma-ray Sky".
- ↑ "Fermi Gamma-ray Space Telescope, In: Wikipedia". San Francisco, California: Wikimedia Foundation, Inc. May 5, 2013. Retrieved 2013-05-05.
- 1 2 3 4 Morrison P (1967). "Extrasolar X-ray Sources". Ann Rev Astron Astrophys. 5 (1): 325–50. doi:10.1146/annurev.aa.05.090167.001545.
- ↑ Kupperian JE Jr, Friedman H (1958). "Experiment research US progr. for IGY to 1.7.58". IGY Rocket Report Ser. (1): 201.
- 1 2 "Astrophysical X-ray source, In: Wikipedia". San Francisco, California: Wikimedia Foundation, Inc. November 9, 2012. Retrieved 2012-12-24.
- 1 2 S. L. Snowden, R. Egger, D. P. Finkbiner, M. J. Freyberg, and P. P. Plucinsky (February 1, 1998). "Progress on Establishing the Spatial Distribution of Material Responsible for the 1/4 keV Soft X-Ray Diffuse Background Local and Halo Components". The Astrophysical Journal 493 (1): 715-29. doi:10.1086/305135. http://iopscience.iop.org/0004-637X/493/2/715/fulltext/. Retrieved 2012-06-14.
- 1 2 3 4 5 6 Martin J. Rees (December 1984). "Is the Universe flat?". Journal of Astrophysics and Astronomy 5 (4): 331-48. http://link.springer.com/article/10.1007/BF02714464. Retrieved 2013-12-18.
- ↑ P. D. Tennyson, R. C. Henry, P. D. Feldman, and G. F. Hartig (July 1, 1988). "Cosmic Ultraviolet Background Radiation and Zodiacal Light". The Astrophysical Journal 330 (07): 435-44. doi:10.1086/166481. http://henry.pha.jhu.edu/p/117.pdf. Retrieved 2013-07-02.
- ↑ "Olbers' paradox, In: Wikipedia". San Francisco, California: Wikimedia Foundation, Inc. April 13, 2013. Retrieved 2013-05-03.
- ↑ "Background noise, In: Wikipedia". San Francisco, California: Wikimedia Foundation, Inc. March 14, 2013. Retrieved 2013-05-03.
- ↑ "Visual snow, In: Wikipedia". San Francisco, California: Wikimedia Foundation, Inc. April 16, 2013. Retrieved 2013-05-03.
- 1 2 Jesse D. Bregman and Joel N. Bregman (May 15, 1978). "The violet opacity of carbon stars". The Astrophysical Journal 222 (5): L41-3. doi:10.1086/182688.
- ↑ C.-I. MengR. E. Huffman (April 1984). "Ultraviolet imaging from space of the aurora under full sunlight". Geophysical Research Letters 11 (4): 315-8. doi:10.1029/GL011i004p00315. http://onlinelibrary.wiley.com/doi/10.1029/GL011i004p00315/full. Retrieved 2013-05-31.
- 1 2 3 4 5 6 7 8 G. Toller, H. Tanabe, and J. L. Weinberg (December 1987). "Background starlight at the north and south celestial, ecliptic, and galactic poles". Astronomy and Astrophysics 188 (1): 24-34. http://articles.adsabs.harvard.edu/cgi-bin/nph-iarticle_query?bibcode=1987A%26A...188...24T&db_key=AST&page_ind=0&data_type=GIF&type=SCREEN_VIEW&classic=YES. Retrieved 2013-05-31.
- 1 2 3 4 5 Anne Minard (February 25, 2009). "Penetrating New View Into The Helix Nebula". Universe Today. Retrieved 2014-02-25.
- 1 2 3 4 5 6 Keith Taylor and Mike Scarrott (February 20, 2013). "The Boomerang Nebula - the coolest place in the Universe?". Baltimore, Maryland USA: Space Telescope. Retrieved 2014-03-12.
- ↑ J. Biretta (September 13, 2005). "Hubble Catches Scattered Light from the Boomerang Nebula". Baltimore, Maryland USA: HubbleSite NewsCenter. Retrieved 2014-03-12.
- ↑ Tony Greicius (October 25, 2013). "Ghostly 'Boomerang'". Washington, DC USA: NASA. Retrieved 2014-03-12.
- ↑ C. Baltay, J. A. Snyder, P. Andrews, W. Emmet, B. Schaefer, and J. Sinnott, C. Bailyn, P. Coppi, A. Oemler, C. N. Sabbey, S. Sofia, W. van Altena, and A. K. Vivas, C. Abad, A. Bongiovanni, C. Briceño, G. Bruzual, G. Magris, and J. Stock, F. Della Prugna, Ge. Sánchez, Gu. Sánchez, H. Schenner, B. Adams, M. Gebhard, R. K. Honeycutt, J. Musser, F. Harris, and J. Geary (July 2002). "A Large Area CCD Camera for the Schmidt Telescope at the Venezuelan National Astronomical Observatory". Publications of the Astronomical Society of the Pacific 114 (797): 780-94. doi:10.1086/341705. http://www.jstor.org/stable/10.1086/341705. Retrieved 2013-12-10.
- 1 2 A. S. Wilson, J. A. Braatz, T. M. Heckman, J. H. Krolik, and G. K. Miley (December 20, 1993). "The Ionization Cones in the Seyfert Galaxy NGC 5728". The Astrophysical Journal Letters 419 (12): L61-4. doi:10.1086/187137.
- 1 2 3 4 5 Tom Broadhurst, Keiichi Umetsu, Elinor Medezinski, Masamune Oguri, and Yoel Rephaeli (September 11, 2008). "Comparison of Cluster Lensing Profiles with ΛCDM Predictions". The Astrophysical Journal Letters 685 (1): L9. doi:10.1086/592400. http://iopscience.iop.org/1538-4357/685/1/L9. Retrieved 2013-07-31.
- 1 2 3 4 5 Riccardo Giacconi, Daniela Calzetti, Mario Livio, Piero Madau, Space Telescope Science Institute (U.S.) - Extragalactic background radiation: a meeting in honor of Riccardo Giacconi : proceedings of the Extragalactic Background Radiation Meeting, Baltimore, 1993 May 18-20, Volume 1993 - Page 137 (Google Books accessed October 2010)
- 1 2 "Diffuse Infrared Background Experiment, In: Wikipedia". San Francisco, California: Wikimedia Foundation, Inc. December 4, 2012. Retrieved 2012-12-24.
- 1 2 "Cosmic Background Explorer, In: Wikipedia". San Francisco, California: Wikimedia Foundation, Inc. November 26, 2012. Retrieved 2012-12-24.
- ↑ T. J. Sodroski, C. Bennett, N. Boggess, E. Dwek, B. A. Franz, M. G. Hauser, T. Kelsall, S. H. Moseley, N. Odegard, R. F. Silverberg, and J. L. Weiland (1994). "Large-Scale Characteristics of Interstellar Dust from COBE DIRBE Observations". The Astrophysical Journal 428 (2): 638–46. doi:10.1086/174274.
- ↑ BLAST Public Webpage
- 1 2 "BLAST (telescope), In: Wikipedia". San Francisco, California: Wikimedia Foundation, Inc. February 4, 2012. Retrieved 2012-06-08.
- 1 2 3 A. J. Barger, L. L. Cowie, D. B. Sanders (June 10, 1999). "Resolving the submillimeter background: the 850 micron galaxy counts". The Astrophysical Journal 518 (1): L5-8. doi:10.1086/312054. http://iopscience.iop.org/1538-4357/518/1/L5. Retrieved 2013-10-22.
- ↑ DMR (10 April 2013). "DMR Images". Greenbelt, Maryland USA: NASA Goddard Space Flight Center. Retrieved 2014-10-19.
- ↑ "Background radiation, In: Wikipedia". San Francisco, California: Wikimedia Foundation, Inc. April 6, 2013. Retrieved 2013-04-12.
- ↑ David T. Chuss. "Nine Year Microwave Sky". Greenbelt, Maryland USA: NASA Goddard Space Flight Center. Retrieved 2014-10-18.
- ↑ White, M. (1999). Anisotropies in the CMB. UCLA. Bibcode: 1999dpf..conf.....W.
- 1 2 3 M. Sato, M. J. Reid, A. Brunthaler, and K. M. Menten (September 10, 2010). "Trigonometric parallax of W51 main/south". The Astrophysical Journal 720 (2): 1055. doi:10.1088/0004-637X/720/2/1055. http://iopscience.iop.org/0004-637X/720/2/1055. Retrieved 2014-04-19.
- ↑ Penzias, A.A.; Wilson, R.W. (1965). "A Measurement of Excess Antenna Temperature at 4080 Mc/s". Astrophysical Journal 142: 419–421. doi:10.1086/148307.
- 1 2 "Cosmic microwave background radiation, In: Wikipedia". San Francisco, California: Wikimedia Foundation, Inc. August 20, 2012. Retrieved 2012-08-29.
- ↑ Fixsen, D. J. (December 2009). "The Temperature of the Cosmic Microwave Background". The Astrophysical Journal 707 (2): 916–920. doi:10.1088/0004-637X/707/2/916.
- ↑ "Energetic neutral atom, In: Wikipedia". San Francisco, California: Wikimedia Foundation, Inc. August 4, 2012. Retrieved 2012-08-12.
- 1 2 nhsc2009 (July 9, 2009). "SPIRE image of M74 at 250 m". Pasadena, California USA: Caltech. Retrieved 2014-03-12.
- ↑ R. J. Thomas and R. A. Young (January 1981). "Measurement of atomic oxygen and related airglows in the lower thermosphere". Journal of Geophysical Research: Oceans 86 (08): 7389-93. doi:10.1029/JC086iC08p07389. http://onlinelibrary.wiley.com/doi/10.1029/JC086iC08p07389/abstract. Retrieved 2013-01-16.
- ↑ Susan Watanabe (May 29, 2008). "Polygonal Pattern on Mars". Washington, DC USA: NASA. Retrieved 2013-03-31.
- ↑ Sue Lavoie (February 21, 2001). "PIA03213: Noctis Labyrinthus". Pasadena, California USA: NASA/JPL. Retrieved 2013-04-01.
- ↑ M.H. Carr, W.A. Baum, K.R. Blasius, G.A. Briggs, J.A. Cutts, T.C. Duxbury, R. Greeley, J. Guest, H. Masursky, B.A. Smith, L.A. Soderblom, J. Veverka, J.B. Wellman (May 9, 1980). "NASA SP-441: VIKING ORBITER VIEWS OF MARS". Washington, DC USA: NASA. Retrieved 2013-04-01.
- ↑ SPACE.com Staff (January 14, 2013). "Baffling Star Birth Mystery Finally Solved". Yahoo! Inc. Retrieved 2013-01-15.
- 1 2 A. Hacar et al. (February 15, 2012). "APEX image of a tar-forming filament in Taurus". ESO. Retrieved 2014-03-13.
- ↑ Patrick Palmer, B. Zuckerman, David Buhl, and Lewis E. Snyder (June 1969). "Formaldehyde Absorption in Dark Nebulae". The Astrophysical Journal 156 (6): L147-50. doi:10.1086/180368.
- 1 2 See, e.g., Table 1 and the Appendix of . doi:10.1088/0004-637X/729/2/133. Missing or empty
|title=(help) - ↑ J. P. Williams, L. Blitz, C. F. McKee (2000). "The Structure and Evolution of Molecular Clouds: from Clumps to Cores to the IMF, In: Protostars and Planets IV". Tucson: University of Arizona Press. p. 97.
- 1 2 3 "Molecular cloud, In: Wikipedia". San Francisco, California: Wikimedia Foundation, Inc. September 28, 2012. Retrieved 2012-10-20.
- ↑ Di Francesco, J., et al. (2006). "An Observational Perspective of Low-Mass Dense Cores I: Internal Physical and Chemical Properties, In: Protostars and Planets V".
- ↑ Grenier (2004). "The Gould Belt, star formation, and the local interstellar medium, In: The Young Universe". Electronic preprint
- ↑ Sagittarius B2 and its Line of Sight
- ↑ Marc H. Pinsonneault, Deokkeun An, Joanna Molenda-Żakowicz, William J. Chaplin, Travis S. Metcalfe, and Hans Bruntt (April 2012). "A revised effective temperature scale for the Kepler input catalog". The Astrophysical Journal Supplement Series 199 (2): 22. doi:10.1088/0067-0049/199/2/30. http://iopscience.iop.org/0067-0049/199/2/30. Retrieved 2013-07-16.
- ↑ ESO00 (September 14, 2000). "Peering into a Star Factory". Paranal: European Southern Observatory. Retrieved 2013-03-14.
- ↑ ESO officials (May 2, 2013). "Dusty Star-Spawning Space Cloud Glows In Amazing Photo". La Silla, Chile: Yahoo! News. Retrieved 2013-05-02.
- ↑ eso1320a (May 2, 2013). "The star formation region NGC 6559". La Silla Observatory, Chile: European Southern Observatory. Retrieved 2013-05-02.
- 1 2 Miriam Kramer (May 2, 2013). "Dusty Star-Spawning Space Cloud Glows In Amazing Photo". La Silla, Chile: Yahoo! News. Retrieved 2013-05-02.
- 1 2 3 4 Richard Hook. "An Anarchic Region of Star Formation". Garching bei München, Germany: European Southern Observatory. Retrieved 2013-05-02.
- ↑ "NGC 6559, In: Wikipedia". San Francisco, California: Wikimedia Foundation, Inc. May 2, 2013. Retrieved 2013-05-02.
- 1 2 C. D. Motchenbacher, J. A. Connelly (1993). Low-noise electronic system design. Wiley Interscience.
- ↑ L. B. Kish, C. G. Granqvist (November 2000). "Noise in nanotechnology". Microelectronics Reliability (Elsevier) 40 (11): 1833–37. doi:10.1016/S0026-2714(00)00063-9.
- 1 2 "Noise (electronics), In: Wikipedia". San Francisco, California: Wikimedia Foundation, Inc. March 12, 2013. Retrieved 2013-05-24.
- 1 2 3 "Voltage spike, In: Wikipedia". San Francisco, California: Wikimedia Foundation, Inc. May 15, 2013. Retrieved 2013-05-24.
- ↑ Transient Protection, LearnEMC Online Tutorial. http://www.learnemc.com/tutorials/Transient_Protection/t-protect.html
- ↑ "Galileo (spacecraft), In: Wikipedia". San Francisco, California: Wikimedia Foundation, Inc. August 7, 2012. Retrieved 2012-08-11.
- ↑ Donald J. Williams (May 14, 2012). "Energetic Particles Detector (EPD)". Greenbelt, Maryland USA: NASA Goddard Space Flight Center. Retrieved 2012-08-11.
- 1 2 "The E and B Experiment, In: Wikipedia". San Francisco, California: Wikimedia Foundation, Inc. December 30, 2012. Retrieved 2013-02-05.
- ↑ Blog post from a member of the EBEX science team describing the launch.
- ↑ YouTube video of the EBEX launch.
- ↑ Clara Moskowitz (February 4, 2013). "Balloon-Borne Telescope Seeks Out Elusive Big Bang Signal". Yahoo! News. Retrieved 2013-02-05.
- ↑ BLAST Public Webpage
- ↑ "Submillimetre astronomy, In: Wikipedia". San Francisco, California: Wikimedia Foundation, Inc. June 2, 2012. Retrieved 2012-06-08.
- ↑ SPACE.com (December 25, 2012). "NASA Launches Telescope-Toting Balloon from Antarctica on Christmas". SPACE.com. Retrieved 2012-12-26.
- ↑ Govert Schilling (December 26, 2012). "NASA Launches Telescope-Toting Balloon from Antarctica on Christmas". McMurdo Station: SPACE.com. Retrieved 2012-12-26.
External links
![]() This is a research project at http://en.wikiversity.org
This is a research project at http://en.wikiversity.org
| |
Educational level: this is a research resource. |
| |
Resource type: this resource is an article. |
| |
Resource type: this resource contains a lecture or lecture notes. |
| |
Subject classification: this is an astronomy resource. |