XQuery/Google Chart Bullet Bar
< XQueryMotivation
You want to create a "digital dashboard" that displays several key performance indicators using a graphical presentation.
Bullet Bars
From this article Bullet Bars with Google Charts we can see that it is easy to create bullet bars using the Google Charts API.
Here is the template that we would like to customize:
Sample URL
http://chart.apis.google.com/chart?cht=bhs&chs=150x30&chd=t:70&chm=r,ff0000,0,0.0,0.5|r,ffff00,0,0.5,0.75|r,00A000,0,0.75,1.0|r,000000,0,0.8,0.81&chco=000000&chbh=10
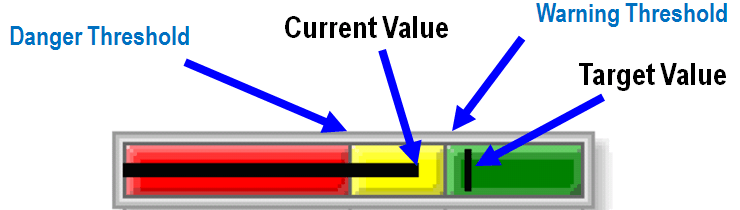
Sample Screen Image
![]()
Declarative XML Representation
An XML representation of this might be:
<chart data-source="my-data.xq">
   <type>bar-gauge</type>
   <height>30</height>
   <width>150</width>
   <danger-threshold>50</danger-threshold>
   <danger-color>red</danger-color>
   <warning-threshold>75</warning-threshold>
   <warning-color>yellow</warning-color>
   <target-value>90</target-value>
   <target-color>green</target-color>
   <current-value>{70}</current-value>
</chart>
This represents the "specification" of the gauge. It can be queried for each value using XPath. Note that the current-value will be put in by the data-source service.
Google Chars Representation
Which must be transformed into the following URL:
http://chart.apis.google.com/chart?
 cht=bhs&
 chs=150x30&
 chd=t:70&
 chm=r,ff0000,0,0.0,0.5|
   r,ffff00,0,0.5,0.75|
   r,00A000,0,0.75,1.0|
   r,000000,0,0.8,0.81&
chco=000000&chbh=10
Input Parameters for the Bullet Bar
Here are the parameters:
  width of the bar in pixels
  height of the bar in pixels
  danger-value width value in pixels of the red part of the gauge
  warn-value width value in pixels of the yellow area in pixels
  ok-value width value in pixels of the yellow area in pixels
  target-value distance to the vertical black target bar
  actual-value value of the central black line
Sample XQuery Function
Note that the width of the danger, warn and ok bars (red, yellow and green) are expressed as a percentage digit from 0 to 100.
declare function local:bullet-bar(
    $height as xs:decimal,
    $width as xs:decimal,
    $danger as xs:decimal,
    $warn as xs:decimal,
    $ok as xs:decimal,
    $target as xs:decimal,
    $actual as xs:decimal
) as xs:string {
let $danger-width-percent := $danger div 100
let $warn-width-percent := $warn div 100
let $ok-width-percent := $ok div 100
let $target-width-percent := $target div 100
let $target-plus-one := $target-width-percent + 0.01
 return concat(
   'http://chart.apis.google.com/chart?cht=bhs&chs=',
    $width,
    'x',
    $height,
    '&chd=t:', $actual,
    '&chm=r,ff0000,0,0.0,', $danger-width-percent,
    '|r,ffff00,0,', $danger-width-percent, ',', $warn-width-percent,
    '|r,00A000,0,', $warn-width-percent, ',', $ok-width-percent,
    '|r,000000,0,', $target-width-percent, ',', $target-plus-one,
    '&chco=000000&chbh=',
    round($height * 0.6)
  )
};
This article is issued from Wikibooks. The text is licensed under Creative Commons - Attribution - Sharealike. Additional terms may apply for the media files.