XQuery/Call Graphs
< XQueryMotivation
You have many XQuery functions and modules and you want to understand the call relationship between them by generating a graph that shows what functions call each other.
Sample Single Module Call Graph
The following is a sample of a call graph for a single module.
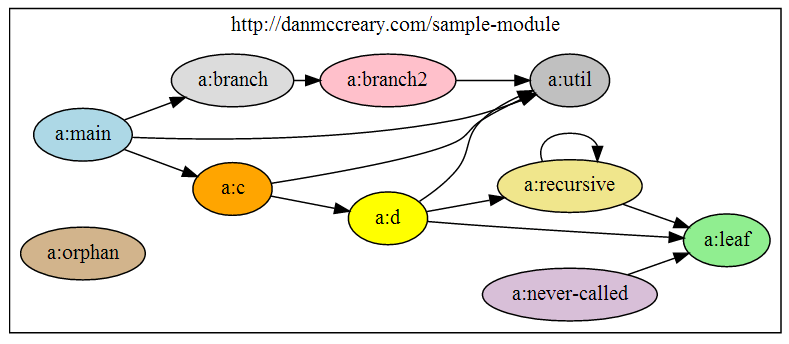
- you can quickly see what functions don't call other functions and are never called (orphan function).
- Some functions call other functions but are not called by other functions within this module.
- Some function are are considered leaf functions since they don't call any functions other than standard XQuery library functions.
- Some functions are called many times by other functions. These are good candidates for utility modules.
- Some functions are only called once. If this is the case you know the impact to functions in this module if it is changed.
- Functions with arrows that point back to themselves are recursive functions
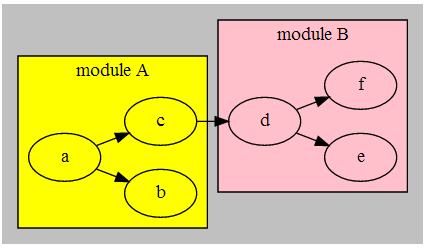
Here is an example of a call graph between modules:
Background
We can extract the call information of a module using the inspect module
or if you have installed the documents locally on your desktop or laptop: local eXist doc
The inspect function will return a structure like this:
<module uri="http://docbook.org/ns/docbook" prefix="docbook" location="/db/apps/doc/modules/docbook.xql">
    <function name="docbook:load" module="http://docbook.org/ns/docbook">
    ...
      <calls>
         <function name="dq:do-query" module="http://exist-db.org/xquery/documentation/search" arity="3"/>
       </calls>
    </function>
</module>
Which we would like to visualize as a graph like the figure above.
Sample Graph Markup Language
<!-- sample XQuery call graph with two modules.
    Module A has three functions, a, b, and c where a calls b and c.
    Module B has three functions d, e, and f where b calls e and f.
    a also calls d which must be placed outside and after the module clusters.
    -->
<graph xmlns="http://www.martin-loetzsch.de/DOTML"  rankdir="LR" bgcolor="silver">
    <cluster id="m1" bgcolor="yellow" label="module A">
        <!-- each function within a module is a node -->
        <node id="m1a" label="a"/>
        <node id="m1b" label="b"/>
        <node id="m1c" label="c"/>
        <!-- each call to another function generates an edge -->
        <edge from="m1a" to="m1b"/>
        <edge from="m1a" to="m1c"/>
    </cluster>

    <cluster id="m2" bgcolor="pink"  label="module B">
        <!-- each function within a module is a node -->
        <node id="m2d" label="d"/>
        <node id="m2e" label="e"/>
        <node id="m2f" label="f"/>
        <!-- each call to another function generates an edge -->
        <edge from="m2d" to="m2e"/>
        <edge from="m2d" to="m2f"/>
    </cluster>

    <!-- inter module calls must be placed AFTER the modules themselves -->
    <edge from="m1c" to="m2d"/>
</graph>
Challenges
GraphViz is a very mature node layout system with many complex features and a non-XML input format.
- There is little feedback information if there are errors in the GraphViz pipeline. We should use try/catch to get more feedback on errors.
- The Dot language does not accept "dash" (-) or colon (:) characters in IDs. If they appear the transform simply returns no results without error messages. These characters must be removed from the IDs and the "label" attribute must be used to display the value on the nodes.
- It would be ideal to have a single XQuery typeswitch transform that does the conversion to SVG, but accurate placement of nodes in a graph is a complex process.
- There should be some ways to adjust the transform placement such as hints that similar function names be grouped together.
- There should be ways to keep this system portable across XML development tools using XQDoc. This depends on the XQDoc tools exporting the right information.
References
- source code on GitHub
- wikipedia article on graph drawing
- wikipedia article on Graphviz
- Dot Markup Language format
- note on adding the xqdoc:invoked and xqdoc:ref-variable support to XQDoc
- A Technique for Drawing Directed Graphs by Peter North et. el.
- DAG - A Program that Draws Directed Graphs
This article is issued from Wikibooks. The text is licensed under Creative Commons - Attribution - Sharealike. Additional terms may apply for the media files.