Trigonometry/Phase and Frequency
< TrigonometryFrequency
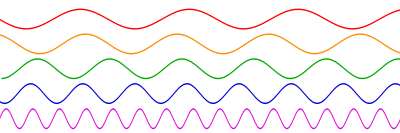
Here are some sinusoidal (that is 'sine like') graphs. These show sinusoidal waves with different frequency. The frequency increases as you go down.
|
Waves and Light In physics light is a kind of wave, and different frequencies of light give the different colors of the spectrum.
|
|
Waves and Sound In physics sound is a kind of wave. It's physically a different kind of wave from light, but its vibrations can still be described using sines and cosines. Light is an electromagnetic wave and sound is a wave involving change in air pressure. That difference is the underlying reason why light can travel through the vacuum of space, but sound cannot. High pitched notes are high-frequency sound waves. Low pitched notes are low-frequency sound waves.
|
Sine and Cosine Graphs
And here in this graph, the colors we've chosen to draw the waves in have no relation to the frequency. Both waves have the same frequency, but we've used different colors.
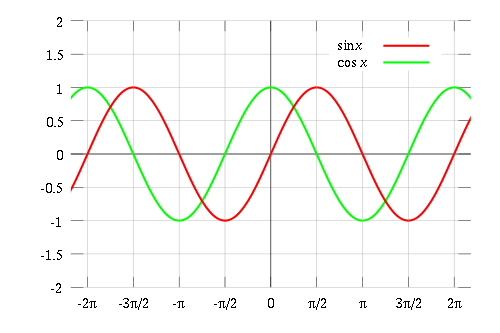
Notice that in the graph of sine and cosine above that the two graphs have the same shape. If we slide the sine graph slightly to the left, it coincides exactly with the cosine graph. Using the terminology used to describe sinusoidal waves, they have the same amplitude, the same frequency and different phases.
Definitions
A sinusoidal wave is characterised by three parameters: amplitude, frequency and phase.
- The amplitude is the amount the function varies, positively or negatively, from zero in the y direction.
- The frequency is how many complete cycles there are of the wave in unit distance on the x axis (which often measures time)
- The phase is relevant when comparing two waves of the same frequency. It is how much (measured in degrees or radians) one is shifted relative to the other on the x axis.
This terminology comes from sound engineering where higher frequency sounds have higher pitch and waves of greater amplitude are louder.
As an alternative to specifying the frequency, the number of cycles in unit distance, we can instead specify the wavelength, the length of one cycle. The higher the frequency, the shorter the wavelength. The lower the frequency the longer the wavelength.
You can check this on the diagram of waves of different frequencies at the top of the page.
In More Detail
Amplitude
The amplitude is the maximum amount that the wave differs from zero, positive or negative. For and (where n is any positive number) the amplitude is 1. For and (where m and n are any positive numbers) the amplitude is m. The difference between the greatest and least value is called the double amplitude or peak to peak amplitude.


Frequency
The frequency is the number of cycles a wave goes through in a standard distance or time. If this standard distance is or radians, the frequency of and is 1, and that of and is n. A graph of a high frequency wave shows more complete cycles in the same horizontal span as a low frequency wave.


The wavelength decreases as the frequency increases. It is the distance over which a complete cycle occurs, that is, the wave goes from 0 to its maximum positive value, back to 0, down to the lowest negative value then back up to 0 again. The functions and both go through a complete cycle as the angle increases by or radians, hence this is the wavelength. The functions and (where n is any positive number) go through one cycle as the angle increases by , hence their wavelength is .


Phase Shift
The phase is the fraction of the cycle that you have reached at any given point. If the point is not specified, it may be assumed to be 0°. The start of the cycle is the point where the wave is 0 and going from negative to positive. (If the wave is not a sine curve, there may be more than one such point in a complete cycle so the starting point may be arbitrary.) For the phase at 0° is 0; for it is ¼. If the cycle has wavelength or radians, the phase is often expressed as an angle corresponding to the given fraction of the wavelength, so the phase of at 0° is or radians.


It is assumed that the average value of the wave is 0. If the wave is say or , it is never 0 so to define the phase we would need the point where it reaches its average value (4 in this case).

Examples
|
Larger Amplitude has ten times the amplitude of The graph oscillates between 10 and -10 on the y axis. |


|
Larger Frequency has a higher frequency than There will be 100 times as many cycles in the same distance along the x axis. The amplitude is unchanged. The wavelength is also decreased. The distance along the x axis for a complete cycle is one hundredth of what it was before. |

|
Different Phase has a different phase from . The phase difference happens to be 90°, because . If two waves are 180° out of phase then where one is positive the other has the same value only negative. is 180° out of phase with |


Offset
Two sinusoidal waves may also have a different offset to each other, i.e. their average values are different, but they still have the same shape. Their graphs are y shifted relative to each other. In sound engineering this is called DC Bias.
|
Different Offset has a different offset to . Whereas takes both positive and negative values, is never below 0. |
