9.0 Notes (page 8)
< Seed FactoriesDesign Baseline
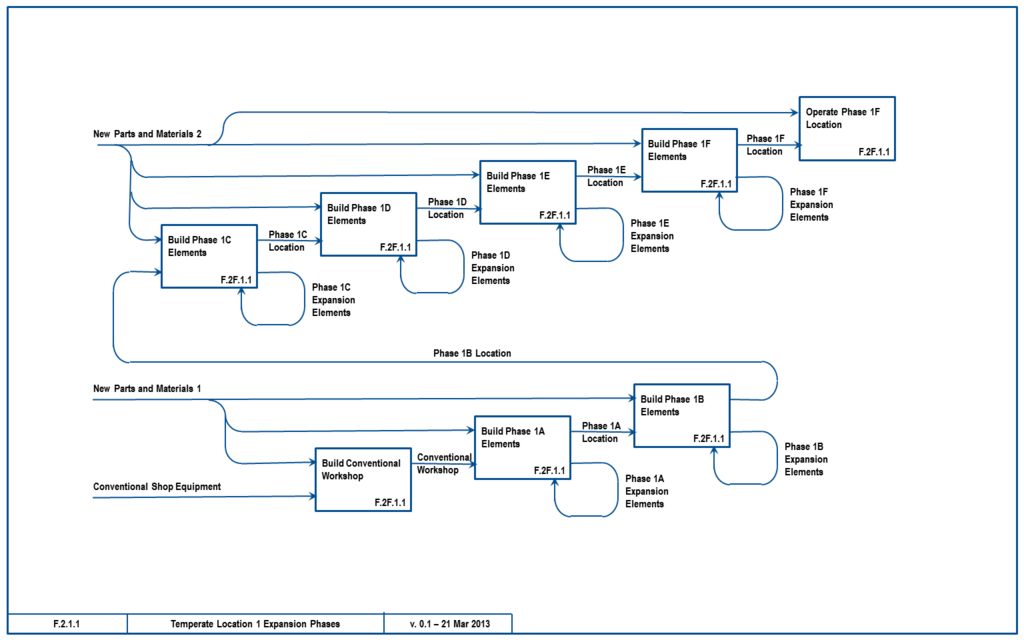
The Personal Factory system is designed to expand in a series of phases (Figure 9.0-1). Each phase takes inputs of energy, parts, and raw materials, and uses them for production of expansion elements to add to the location, as well as desired outputs. As the new elements are completed, they are immediately put to use, and become part of the next phase for further development. The development of the location is actually a continuous process, but breaking it into discrete phases simplifies the design task, since each phase has fewer new items. A particular phase is described in the following sections by (1) a set of initial performance goals which that phase will meet, (2) a list of system elements which make up the location at the start of the phase, and (3) the set of changes within the phase by adding, modifying, or removing elements to reach the next phase. In general, each phase has a larger quantitative output capacity, a more diverse set of production equipment that can make a wider range of outputs, and higher levels of automation and integration.
Output Goals
The general output goal is to provide some of the physical needs for a steadily increasing number of people until the maximum design capacity of the location is reached. For example, food is one of the outputs, and we start Phase 1A with supplying food for 0.25 people the first year, increasing by 0.25 people/year. The steady growth will require preparing more land and producing more farm equipment by the factory.
We start to make the easier outputs in the early phases, with the more difficult ones added later, when the Factory has more capacity and types of equipment available. Therefore performance improvements, in terms of percentage of physical needs met, will get smaller with each phase as the harder products are added. At the same time the quantity of outputs grows in size with each phase. This is for two reasons. First, the equipment is designed to make copies or larger versions for itself, so the rate of growth compounds with each phase. Second, as it becomes more integrated and automated, the cost of production goes down, and therefore more people will want the outputs it produces.
The fraction of physical needs being met is measured in economic terms calculated from the current (Jan 2013) Consumer Price Index (CPI). The index is compiled from surveys of what people spend their money on in the US. Since our goal is to satisfy the factory owner's and customer's needs, the CPI serves as proxy for what people want. The actual owners may want a different mix of products, but this serves as a starting point for design. The index can be divided into goods and services, with the former being physical material and energy needs. The second number for each of the goods items is the percentage of the goods category:
Goods: 77.1% of total consumer items (100% of Goods)
- Food & Drugs - 16.0% (20.75%)
- Energy (including fuel) - 9.6% (12.45%)
- Household furnishings and supplies 3.3% (4.3%)
- Clothing - 3.5% (4.55%)
- Vehicles - 5.5% (7.15%)
- Entertainment, education, & communication goods - 2.8% (3.65%)
- Alcohol, tobacco, personal care, & misc - 2.6% (3.35%)
- Shelter (incl maintenance, insurance, utilities other than energy) - 33.8% (43.8%)
Services (22.9%)
- Medical Care - 5.5%
- Transportation services (lease, maintenance, insurance, fees, public transport) - 5.8%
- Recreation services - 3.7%
- Education and Communications Services - 6.2%
- Personal Services - 1.7%
- Total - 100.0%
We do not try to design our factory to supply the services category (at least not in Phase 1). We assume that services are provided by residents at the location, or by outside suppliers. The factory can, however, supply the physical needs to make the services possible. For example, it will not supply medical care directly, but it can provide the buildings and utilities for that service, thus lowering its cost.
System Elements
Element Organization
We use a common organization structure across the entire project, which groups items by their function. Using a consistent system makes it easier to track changes across the various phases.
Element Naming
We want a consistent method to name the various system elements and their designs. Our method includes
- Element Name - A unique name to identify the element
- Model - A number to identify element scale in linear size (%), power output, or other parameter
- Type - A letter to identify different designs to perform a given function,
- Version X - Date - A number and date to identify a particular revision of the design
Example: Solar Furnace, Model 10, Type A, Version 0.1 - 22 Mar 2013
Phase 0: Conventional Workshop
The first phase of the Personal Factory project (1A or Seed Factory) has a set of starter equipment that must be built somewhere. We will assume that is done in a conventional workshop at the location, and uses purchased tools, equipment, parts, and materials. The purchased tools and equipment are types which did not need to be custom designed for this project. Prior to final production of the starter set, we assume we need to build some prototypes to test the processes and validate their performance. Therefore the workshop equipment list will includes items needed to build the prototypes as well as the final version of the Phase IA "Seed Factory" elements.
As the prototypes and 1A starter set elements are completed, they can assist in further production. To whatever extent they remain useful, the conventional workshop equipment will remain part of the later phases. Some items may be custom-built at outside locations if it is not practical to make them locally.
Workshop Planning
To help cover the cost of a conventional workshop, it should be attractive to outside users or make useful products. Features that can be included to make it attractive include operating it as a maker-space or business incubator. Users would pay a membership fee for access to the equipment, or lease working space. For security, a combination of roll-up doors (as in self-storage places) and roll-away lockable work carts can be provided. The work carts can be taken out and put away with work in progress, and brought to different tool areas. Larger users might have shipping containers for storage. For business incubators, separate offices or outside doors can be provided, or a shared merchant area. All of this would use a modular design, so that layouts can change as needed. The combined workshop + other areas would expand over time.
Phase 1A (Seed Factory)
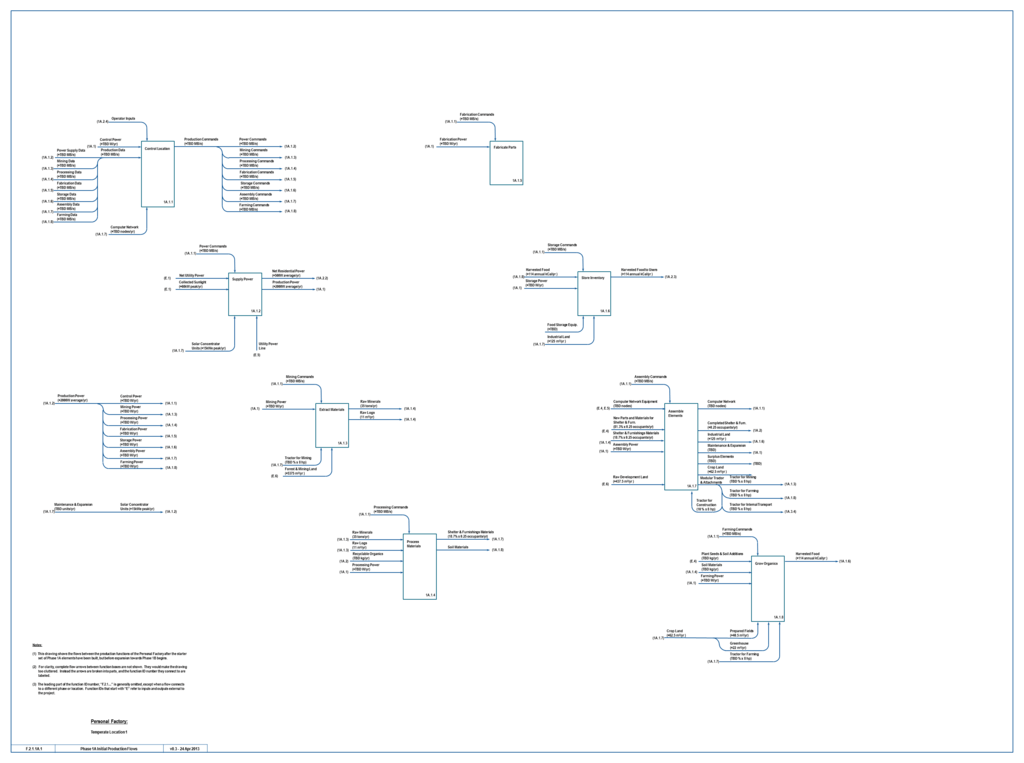
The Phase 1A Seed Factory adds a starter set of automated equipment to the conventional workshop, starts to produce useful outputs, and begin the expansion process that leads to later phases (Figure 7.0-2). The block diagram shows the 8 major parts of the factory and the flows that move between them, and to and from the outside. The diagram is a version 0.3 draft, and does not yet show all the flows. The flow arrows would make the diagram too cluttered if they were continuous from box to box. Instead, only the ends are shown, and labels are provided for where the other end connects. Where flows divide or merge, the single merged flow is equal to the sum of the pieces.
Performance Goals
- General Goals - We target Phase 1A initial capacity to meet 27% of the physical needs (goods) for 0.25 people per year, by economic value. In turn physical needs are 77.1% of all consumer items. Food, shelter, and utilities are among the most basic needs, so we divide our 27% to be 8% from energy, 10% from food, and 9% from shelter/furnishings, or about 64%, 48%, and 19% of those category needs respectively. In addition to these "customer" outputs, the Phase 1A elements also produce parts for the next expansion phase, replacement items to maintain itself, and surplus outputs to pay for items it cannot make. In more detail, we break down the goals as follows:
- Energy - From the US Consumer Price Index (CPI) data we have a breakdown of the 12.45% of physical needs costs spent on energy into 7.5% for fuels, and 4.95% for utilities. To meet our 8% of physical needs goal, then we should supply some of each, or sell a surplus to pay for the other. Energy needs could be met with all electric vehicles and utility power, or by generating fuels such as with microorganisms, or a mix. Note that these are end user energy amounts, internal power for production will be in addition.
- Food - Of the 16% of the total consumer budget assigned to food & drugs, the CPI indicates:
- - Cereal and bakery - 2.4%
- - Meats, fish, and eggs - 3.7%
- - Dairy - 1.6%
- - Fruits & Vegetables - 2.4%
- - Drink & Beverage - 1.7%
- - Ingredients & Other Foods - 4.2%
Therefore to meet the goal of 10% of physical needs (7.7% of total consumer budget) we need to supply a bit less than half of these categories. The mix of foods to grow will depend somewhat on what is easy to do at an early stage, and end user preferences.
- Shelter and Furnishings - This category accounts for 48.1% of physical needs, and we want to obtain 9% from it, or 18.7% of this category. From NAHB 2011 average home construction costs, we have the following partial components, from which we can select enough to reach 18.7%
- - Excavation, Foundation, Backfill - 9.3%
- - Framing, Trusses, and Sheathing - 14.7%
- - Roofing - 2.9%
- - Siding - 4.7%
- - Drywall - 4.4%
- - Cabinets and Countertops - 5.6%
- - TOTAL - 41.6%
- Expansion - The goal for the next phase is to meet 47% of physical needs for 1.0 people per year, which is 4 times more. Therefore it needs a large jump in capacity and somewhat wider range of outputs. The details will need to be filled in after the next phase is described. The rate of expansion is determined by the combination of surplus outputs and inputs of new parts and materials, labor, and funding from project members.
- Maintenance - We will assume 3% per year replacement of facilities (buildings and fixed land improvements) and 5% per year replacement of machinery and vehicles. High wear parts like cutting tools will need individual working life estimates. Maintenance includes already built end items like shelter, therefore will increase with the stock of finished items.
- Surplus - For this phase we will assume 100% surplus energy and material outputs above what is used to meet physical needs and maintenance. The surplus is used for expansion, to make custom items on demand, or for sale. Income from sales is used to buy items the Factory cannot make or goes to the owners.
Outputs
Having set our performance goals, we now turn those into more specific output capacities by type:
Energy Supply Outputs
We want to supply 8%/12.45% = 64% of energy needs as part of the overall goal of supplying 27% of physical needs in this phase. The question is then what type of energy will be supplied? For local and sustainable sources we see three early options: solar, biofuel, and wind, with the possibility of using a mixture of them.
- Solar Concentrator Option - The simplest option for energy supply is to have one type of power generation, and sell the surplus to pay for the remaining types. Georgia Power is offering to buy solar-generated power at $0.13/kWh, so we will use that as a rate baseline. As a first estimate, we will use 15.6 kW/person average power required for all purposes (not just residential). This is based on the 2011 US average of 10.4 kW, adjusted upwards for a high quality of life. The US residential use in 2009 for single family detached homes was 1270 W/person average, which we adjust up to 2.0 kW. For an annual addition of 0.25 person capacity we require 3.9 kW of new total new power, and our goal is to supply 64% of that, or 2.5 kW more power/year. For concentrated solar, we get 4 hours/day average output at this location, therefore we need 15 kW peak power generation. Given 25% solar-to-electric conversion efficiency, we then need 60 kW peak solar input for all electric output, and only 15 kW solar input for direct thermal use. The actual solar input required will then depend on the mix of power needed. We will assume the worst case of all electric for sizing purposes.
- The annual value of one unit of capacity is 2.5 kW average x 8,760 hours x $0.13/kWh = $2,847/year. On-site storage is not likely to cover all needs, and peak demands for high-energy processes are likely to exceed the peak power generation. Therefore we assume a "net metering" connection to the utility grid. This sells surplus power when generated, and draws power from the grid when needed, and the utility bill represents the net used/sold. Any surplus power sales are used to pay for other forms of energy such as transport fuels. Peak process needs can be met by auxiliary electric heating drawing from the grid, above whatever the solar concentrators can produce.
- To meet our specified goal, 15 kW of peak electric output is built each year at the start of Phase 1A. With no previous experience, and a desire to use concentrated solar for different purposes (electric power, industrial furnaces), we adopt a starter size of 3750 W electric/15 kW thermal. Therefore 4 units this size need to be built the first year. With experience, we can nominally build 2 x 7500 W electric the second year, and 1 x 15 kW electric the 3rd and 4th years. The actual mix of unit sizes will be determined by what we need them for, but later growth phases serve more people and have higher outputs, so we plan a general increase in unit size over time. The nominal unit sizes total 60 kW peak electric to serve 1 person's desired level of energy needs in 4 years. The set of 8 units in various sizes should cover the diversity of industrial/power needs with different targets at the focus.
- Energy Payback - The solar concentrator is estimated to use 10 kg glass and 20 kg steel/m2. The embodied energy, as tabulated in the Inventory of Carbon and Energy, for recycled glass is 11.5 MJ/kg, and for recycled steel sections is 10 MJ/kg. Thus the energy required/m2 is 315 MJ/m2. Given 800 W/m2 collected, including mirror efficiency x 4 hours average operation/day, we supply 11.5 MJ/day thermal energy. Thus the thermal energy payback is 27.5 days, and electrical energy payback is 110 days. The actual payback time will then depend on the mix of electric and thermal power required.
- Solar PV Option - Photovoltaic (PV) produces power for slightly more hours/day than concentrators because it still functions in partly cloudy conditions. Making solar cells in our Seed Factory would not be easy with our Phase 1A set of equipment. Instead we assume they can be purchased and self-installed to generate supplementary power.
- Biofuel Option - Biofuels include burning waste matter from trees and plants grown for other purposes, purposely growing plants for their woody or oil products, and algae and other microorganisms grown or tailored for fuel products. Microorganisms have the highest area efficiency, but trees and crop plants are simpler to set up.
- Wind Option - Various small wind turbines are simple enough to be built with an early phase factory, so we will include this as a supplement to thermal power. The Atlanta Georgia area wind speed at 80m above ground averages 5 m/s. A reasonably designed wind turbine can average 80 W/m2 output given that condition. For a small unit of 2.5 kW average output, we need a 3.15 m blade radius. Since this is small relative to the height above ground, we envision a lightweight truss tower with mounting for additional turbines. Power is transmitted to a generator set at ground level via a drive cable to minimize mass on the tower. The generator rotates to match the angle of the turbine, which is aligned with the wind by a tail surface. Higher power units are simply larger in radius. Excess power is delivered to the local electric grid.
- Mixed Enegry Option - For Phase 1A this has the drawback of designing the Seed Factory to make multiple products and therefore more complex, but we will look at the possibility. For later phases, biological sources of raw materials for farm improvement or chemical processing may be attractive even though more complex.
Food Supply Outputs
- Land Area Required - Efficient greenhouses under good conditions can produce 2700 food calories/m2/year. Given average needs of 2500 calories/person, we get a required area of 338 m2/person for 100% of dietary needs. We will round this up to 350 m2. Field crops have the following caloric yields/m2/yr: Potatoes = 2275, Corn (maize) = 1850, Rice = 1825, Wheat = 740, Soybean = 690. Taking an average we get 1475 kcal/m2/yr. This value depends on having good soil, with the right amendments of organic matter, fertilizer, biochar, lime, and rock dust for best plant growth. The area needed is 618 m2 which we round up to 650. Assuming half greenhouse and half open fields, we get a land requirement of 500 m2/person to provide a 100% diet.
- Our goal in this phase is to provide a bit under half the diet of 0.25 people per year, so the growing area addition required is 62.5 m2/year, of which 22 is greenhouse, and 40.5 is open field/garden. These are fairly small areas, so we will assume the acquired land is larger, and additional greenhouse and fields are prepared each year. Our Phase 1A Seed Factory then needs to output the materials and equipment to build this area, and then operate it afterwards.
Shelter and Furnishings Outputs
We want to supply 9% of physical needs from these categories to meet the overall goal. Shelter and furnishings account for a total of 48.1% of physical needs, therefore we want to supply 18.7% of typical construction cost. Candidates include Roofing, siding, and drywall (12%), Excavation, foundation, and backfill (9.3%), Framing and cabinetry (20.3%), and Furnishings (3.3%). These total 44.9% of construction costs, so we only need to supply some of them.
- Roofing, Siding, and Drywall - These amount to 12% of total construction cost. We can make cement, cement/fiber composite, tile, or brick units to provide about 9% of the 12% for this category. The other 3% is assumed to be harder to make items like underlayments, flashing, and structural ties.
- Excavation, Foundation, and Backfill - We will assume we can meet 7% of the 9.3% of construction costs in this category. The other 2.3% would be specialty items we don't make in our Seed Factory. Site work/person is estimated at 800 m3, including digging, hauling, and backfill. For 0.25 person/yr, then the demand is 200 m3/yr. Assuming 10% of one person's attention is given to this task, and weather allowances, we need an output of 7.4 m3/day for one machine. For foundations, we estimated 30 m3/person of concrete. For 0.25 person/year, then we need 7.5 m3/year. At 400 kg/m3 cement then we need 3000 kg cement, and 4500 kg raw ingredients to make the cement. We also need 15,000 kg aggregates. For a starting total of ~20 tons of raw ingredients, it will take about 3 days for our excavator to extract and haul the materials. We assume reinforcing is bought in this phase of the factory. In addition to the gravel and sand used in concrete, we assume an equal amount is used under slabs and for drainage and driveways. This is another 15 tons, or 10 m3.
- Framing and Cabinetry - These categories combined are 20.3% of construction cost, and we assume we can supply 18% of cost from this category. The remainder is hard to find or make items like specialty woods, glues, and fasteners. We estimate total needs of 110 m3/person for finished lumber. 0.25 person/year then requires 27.5 m3/year. The amount of wood required in this phase depends how much of the total goal is met by the other categories. If 6% of construction cost is covered, then about 30% of the lumber is needed, or 8.25 m3/year. With a desired workload of 10% for lumber production, we get a rate of 0.3 m3/day. Since the yield from raw logs is around 75%, then the raw log volume needs to be 0.4 m3/day.
- Average US Southern forest contained 14.8 m3 (524 cf) softwood and 19.5 m3 (690 cf) hardwood timber/acre, with net growth of 0.85 and 0.68 m3 (30 and 24 cf)/year respectively. Initial construction then requires clearing 1.3 ha(3.2 acres). We use 0.2 ha/person for production and habitation, and need 2.15 ha/person for sustained wood for maintenance. Thus our maximum land needs are 2.15 + 0.2 = 2.35 ha/person, of which we clear a small portion and thin about 50% of the rest for initial construction, and leave the remaining trees and regrowth to supply continuing needs. Land with a high level of timber stock and fertility can reduce this substantially, as well as good timber management practices.
- Furnishings - We estimate we can get about 1.5% of the 3.3% for the furnishings category from wood furniture. Home furnishings typically have a lot of other types of materials in items like window coverings, carpets, and cushions.
Expansion Outputs
We do not know the rate of expansion to the next phase because we don't know the level of contributions from project members in advance. We will assume this rate is US$1500/month, to which we add our surplus outputs either in the form of direct production, or sales to pay for new items. The nature of the expansion outputs is to enable annual production of user needs for 6 2/3 times as much energy, and 7 times as much food and shelter/furnishings, with a wider range of outputs.
Maintenance Outputs
Maintenance can be divided into items the factory can replace internally, and items which need to be supplied from outside. For those which must be supplied from outside, the project sells items it can make to pay for those it cannot. Even the Phase 0 conventional workshop equipment will need maintenance. These can be examined for replacement by internal production rather than purchase.
Surplus Outputs
Surplus outputs during Phase 1A will rise from 100% at the start of the phase, to 250% of needs + maintenance by the time Phase 1B elements are completed.
Phase 1A Elements List
The following are the elements identified to support the outputs of this Phase. They are listed by function numbers, where 1A represents the Phase at this first project location, and the next digits are 1 for production, 2 for transport, and 3 for habitation.
1A.1.1 Control Location
- Computer Network - We assume the automated equipment is controlled by a factory network and computers, with suitable software.
1A.1.2 Supply Power
- Solar Furnaces - For powering the factory and satisfy personal needs, we make a first estimate of total required power capacity = (15 kW electric/60 kW thermal solar furnaces per year + (5% maintenance x accumulated capacity)) x (2.0-3.5 surplus multiplier based on completion towards Phase 1B) x (1.0-7.0 scale multiplier based on completion towards Phase 1B). Phase 1A end point power is then about 375 kWe/1.5 MW thermal, which requires about 3/8 hectare collector area. This in turn requires glass mirrors and structural parts for the heliostats, drive system, and focal targets for thermal and electric generation. The latter can use hot rock storage if around-the clock power is wanted. This will need iterative revision as the other parts are sized.
- Wind Turbine Towers - We install some mix of elevated turbines to supplement the solar furnaces. They feed surplus power to the grid, and the factory draws extra power when needed back from the grid.
1A.1.3 Extract Materials
- Excavation - We estimated 7.4 m3/day as the initial required capacity for excavation/earthmoving to meet end needs. We multiply this by 2.0 for our initial surplus capacity. A conventional 1/2 cubic yard excavator can do 200 "bank cubic yards" (material in the ground) per day , or 153 cubic meters. This uses an 80 H.P Backhoe/Loader and a crew of two. Scaling linearly, we would need a 6 kW (8 H.P.) machine with a 40 liter backhoe for our desired production rate. This is approximately the size of a Bobcat 418 Compact Excavator. The backhoe arm and loader bucket are attachments to the modular tractor. At the end of the phase, we assume 40% operator time rather than 10%, but the increased range of outputs and surplus drives a need for a three times larger unit, thus a 18 kW (24 H.P.) unit with 115 liter (1/9 m3) bucket.
- Logging - Cutting down trees is hazardous, due to the large potential energy they contain. We would like to cut the trees remotely with a tractor attachment, and protect the tractor itself with a sturdy cover in case the tree falls the wrong way. Once a tree is felled and cut up, we use a log arch to pick up the logs and transport them out of the forest.
1A.1.4 Process Materials
- Glass - For Heliostats @ 10 kg/m2 x 75 m2/yr @ 80% efficiency to result in 60 kW thermal = 750 kg/year. We assume remelted scrap glass. The solar furnaces provide power to do the melting, and we need to add melting and casting hardware to the generic furnace. This would include a melting pot, mirror mold, and annealing oven, which might all be the same unit, depending on design
- Metal - For Heliostats @ 20 kg/m2 x 75 m2/yr = 1500 kg/year. We assume remelted scrap metal, cast to bars, and roll formed to structural shapes.
1A.1.6 Store Inventory
- Industrial Land - We estimated 500 m2/person is needed for production and storage land, of which 200 is buildings and equipment. Thus for 0.25 people/year we need to develop an added 125 m2/yr of land and 50 m2/yr of buildings on that land. This is added to whatever industrial land and buildings were developed in Phase 0 for the conventional workshop. The actual areas will be determined later by summing the individual needs. For now we assume all the buildings are heavy industrial enclosed type with a modular 1 x 1 x 0.2 m concrete floor. This requires about 35 tons/yr of materials for the concrete and gravel base and driveways. Excavation and drainage will depend on the terrain.
1A.1.8 Grow Organics
- Field Implements - These are attachments to the modular tractor to perform typical crop tasks. The land areas are small by conventional farming standards, more like home garden size, so the implements will be correspondingly small.
- Greenhouse - Like other parts of the system, we design the greenhouse to be modular and expandable. For durability we choose glass as the transparent material, likely with a truss frame for support. For winter use, we include thermal insulation panels and reflectors to increase lighting. For summer use we include evaporation coolers. Internal partitions or chambers can control the environment for particular plants, and racks can increase growing area. A greenhouse robot of some kind is used to automate repetitive tasks. Conceptually this either runs on a bridge crane type system the length of the greenhouse, or a freestanding vehicle.
1A.2.1 Protect from External Environment
- Land - All project land is included in this element, although it is used for different functions, such as growing food, foundation support, and roads for transport. At the start of Phase 1A we need 1.3 ha of average timbered land to clear for each full person for initial construction, and 2.15 ha for sustained wood production. The land at least requires logging rights if not fully owned. These are average values, and depend on current timber stock and soil conditions. Out of the timber land, or as separate parcels, we use 0.2 ha/full person to be developed for production and habitation.
1A.3.4 Supply Internal Transport
- Modular Tractor - For internal low speed/high torque transport we adopt a modular farm tractor type of design, with a common chassis and power supply and multiple manual and robotic attachments. This is a subset of modular robotics used throughout the project.
Control is optionally by a seated operator, a remote manual control unit, or a local automated control system. The control systems can be swapped out like other attachments, converting the tractor from manual to automated. In this early phase, we aim for simplicity of manufacture, so we adopt a piston or turbine steam engine which drives a hydraulic pump. An electric drive may have lower maintenance, but fabricating copper wires and batteries in the factory is more complicated as a starting point, so we consider that as an alternative for later study. The fluid pressure drives the wheels and attachments via hydraulic motors and cylinders. We plan to use a bio-origin hydraulic fluid for safety. Any of a number of heat sources can be used to generate steam, including liquid fuels, wood, or stored thermal energy. A radiator is used to condense the water for re-use. The size of the chassis is determined by the excavation task, which we assume is the most heavy-duty operation. Other tasks (logging, tilling, and general transport) will use attachments scaled to the chassis size and power output.
- Electric Alternative - An all-electric alternative may prove simpler to design. We list all the elements for a modular robotics set here, although only some are needed in the early phases. All elements are designed to be exchanged by the robot itself or another robot.
- Power Source:
- Fixed solar array charging station - Replaceable battery packs - can be left at the charging station and swapped as needed, or charge the robot by parking it. - Direct rail contact or plugs for fixed location operations
- Base chassis in various sizes to which other items are attached
- Wheel kits for indoor factory or outdoor use
- Seat and controls kit for passenger use
- Camera, transmitter, and control unit for remote control and autonomous use
- Robot arms with various end tools stored in a toolbox
- Base plate for non-mobile robot
- Pallet/Box attachments for cargo
- Trailer mounts for cargo
- Other power attachments for materials handling, stabilizers, excavator arms, etc.
Phase 1B
Performance Goals
- General Goal - At the start of this phase we target the capacity to meet 47% of physical needs for 1.0 people per year, by economic value. We want to show that self-expansion of the Factory can improve performance in all categories. Thus we increase the energy component to 13%, which is a slight surplus, food to 16%, which is most food excluding drugs, and shelter and furnishings to 18% from 9%. Later work may find a more optimal growth path. For now we just want to demonstrate at least one path that works. In addition to meeting more physical needs, we also want to produce items for the next expansion phase, replacement items for maintenance, and a surplus in this phase which starts at 250% over internal needs.
- Shelter and Furnishings - We increased our goal to 23/37 = 62% of construction costs
Phase 1C
Capacity to meet 61% of physical needs for 4 people per year, by economic value.
Phase 1D
Capacity to meet 72% of physical needs for 12 people per year, by economic value.
Phase 1E
Capacity to meet 80% of physical needs for 32 people per year, by economic value.
Phase 1F
Capacity to meet 85% of physical needs for 75 people per year, by economic value.