Linux Applications Debugging Techniques/The debugger
< Linux Applications Debugging TechniquesPreparations
Someday some hard to reproduce issue will be found on a production machine. Typically, such a machine is difficult to access, has no development environment and nothing can be installed on it. At most it will have gdb, but very likely not. Typically also, the heaviest user will be the one to find the issue and typically still, the heaviest user is the one being the bigger -- money-wise. And that issue has to be root cause diagnosed and fixed.
Unless the application has been prepared for this forensic gathering moment, not much can be done to diagnose where the issue is. Thus, preparations should start with compilation:
- Have a "symbol server" and make sure it is reacheable. Compile on the symbol server.
- Compile the release with debugging symbols. Strip them if you do not want to ship them but keep them.
- Ship gdbserver with the application for remote debugging.
These preparations will allow one to:
- Debug the application running on any machine, including machines where there is no gdb installed.
- Debug from any machine that has network visibility to the symbol server.
Also, think beforehand how would you debug on the machine:
- Embed a breakpoint in the code, at hard of reach places of interest, then
- Start the application
- Attach to it with the debugger
- Wait until the breakpoint is hit
The "symbol server"
One way to easily reach the right code from within the debugger is to build the binaries within an auto-mounted folder, each build in its own sub-folder. The same auto-mount share should be accessible from the machine you are debugging on.
Debian
- Install autofs
- In /etc/auto.master uncomment the line:
/net -hosts
- In /etc/exports export the folder:
# Build directory: rw for localhost, read-only for any other host
/home/amelinte/projects/lpt/lpt  localhost(rw,sync,no_subtree_check)  *(ro,root_squash,no_subtree_check)
- As root: restart autofs & nfs and export the build share:
/etc/init.d/autofs restart
/etc/init.d/nfs-kernel-server restart
/usr/sbin/exportfs -a
Redhat
- Export the folder: edit /etc/exports
- As root (RedHat): service autofs start
Finally, build the binaries within the automounted directory on the build machine (here the build machine is bear):
cd /net/bear/home/amelinte/projects/lpt/lpt.destructor
make clean
make
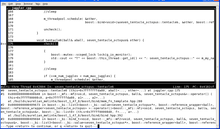
Notice the filename path that is resolved with the symbol information:
[0x413464] lpt::stack::call_stack<40ul>::call_stack(bool)+0x52
        At /net/bear/home/amelinte/projects/lpt/lpt.destructor/lpt/include/lpt/call_stack.hpp:74
        In binaries/bin/stacktest
If the symbols have been stripped from the binaries, point gdb to the folders where the symbols are with the debug-file-directory directive.
References
Remote debugging
- On the machine where the application runs (appmachine):
- If gdbserver is not present, copy it over.
- Start the application.
- Start gdbserver: gdbserver gdbmachine:2345 --attach program
- On gdbmachine:
- At the gdb prompt, enter: target remote appmachine:2345
Sometimes you may have to tunnel over ssh:
- On gdbmachine:
- ssh -L 5432:appmachine:2345 user@appmachine
- At the gdb prompt: target remote localhost:5432
References
Attaching to a process
Find out the PID of the process, then:
(gdb) attach 1045
Attaching to process 1045
Reading symbols from /usr/lib64/firefox-3.0.18/firefox...(no debugging symbols found)...done.
Reading symbols from /lib64/libpthread.so.0...(no debugging symbols found)...done.
[Thread debugging using libthread_db enabled]
[New Thread 0x448b4940 (LWP 1063)]
[New Thread 0x428b0940 (LWP 1054)]
....
(gdb) detach
Embedding breakpoints in the source
On x86 platforms:
#define EMBEDDED_BREAKPOINT asm volatile ("int3;")
Or a more elaborate one:
#define EMBEDDED_BREAKPOINT \
    asm("0:"                              \
        ".pushsection embed-breakpoints;" \
        ".quad 0b;"                       \
        ".popsection;")
This will break into the debugger on hard to reach conditions:
    if (cpuload > 3.1416 && started > 111*MINS*AGO && whatever-dynamic-condition)
    {
        EMBEDDED_BREAKPOINT;
    }
References
Data breakpoints (watchpoints)
Watchpoints can be implemented either in software either in hardware if the CPU supports it. Typically on an Intel processor there are eight debug registers out of which only four can be used for hardware breakpoints and this limits the number of watchpoints system wide.
Breakpoints conditional on caller
This requires gdb 7.9 or later, configured with python support:
(gdb) break funcA if $_caller_is("funcB")
The text user interface
GDB features a text user interface for code, disassembler and registers. For instance:
- Ctrl-x 1 will show the code pane
- Ctrl-x a will hide the TUI panes
None of the GUI interfaces to gdb (Qt Creator stands out for being intuitive and easy to use) can offer access to all of the gdb functionality.
curses gdb offers an improved TUI. A comprehensive list of debugger GUIs is available here.
Reverse debugging
As an example, reverse debugging is a functionality no GUI offers access to:
(gdb) l
1	/* 1 */ int var;
2	/* 2 */ int main (void) {
3	/* 3 */   int i; for (i=0;i<100;i++)
4	/* 4 */     var=i/10;
5	/* 5 */  return 0; }

(gdb) start
(gdb) record
(gdb) adv 5
main () at history.c:5
5	/* 5 */  return 0; }

(gdb) watch var
Hardware watchpoint 2: var

(gdb) reverse-continue
Continuing.
Hardware watchpoint 2: var

Old value = 9
New value = 8
0x00000000004004c3 in main () at history.c:4
4	/* 4 */     var=i/10;
(gdb) p i
$1 = 90

(gdb) reverse-continue
Continuing.
Hardware watchpoint 2: var

Old value = 8
New value = 7
0x00000000004004c3 in main () at history.c:4
4	/* 4 */     var=i/10;

(gdb) p i
$2 = 80
Register watch
You can watch registers. Note this will force the debugger to single step the debugged program and it will run very slowly:
(gdb) watch $ebp
References
.gdbinit
As a note, in upcoming gdb releases, .gdbinit will be replaced by gdb-gdb.gdb:
gdb-gdb.gdb
 ^   ^   ^
 ^   ^   ^---- It's a gdb script.
 ^   ^         If it were Python this would be .py.
 ^   ^
 ^   ^-------- "-gdb" is a gdb convention, it's the suffix added to a file
 ^             for auxiliary support.
 ^             E.g., gdb will auto-load libstdc++.so-gdb.py (version elided)
 ^             which contains the std c++ pretty-printers.
 ^
 ^------------ This init script is for the program named "gdb".
               If this were for readelf the script would be named
               readelf-gdb.gdb.
C++ support
Canned gdb macros
Mangling
gdb might need a bit of guidance with C++11 binaries:
(gdb) set cp-abi gnu-v3
(gdb) set language c++
(gdb) maintenance demangle _ZNSt16nested_exceptionD2Ev
std::nested_exception::~nested_exception()
Templates
One can eventually use [templight https://github.com/mikael-s-persson/templight] to debug and profile templates.
Getting the subclass from the base class pointer
(gdb) python print(x.type)
SuperClass *
(gdb) python print(x.dynamic_type)
SubClass *
References
- gdb & lib debugging support
- https://sourceware.org/gdb/onlinedocs/gdb/JIT-Interface.html
- https://sourceware.org/gdb/current/onlinedocs/gdb/Unwinding-Frames-in-Python.html