Fundamentals of Transportation/Trip Generation
< Fundamentals of TransportationTrip Generation is the first step in the conventional four-step transportation forecasting process (followed by Destination Choice, Mode Choice, and Route Choice), widely used for forecasting travel demands. It predicts the number of trips originating in or destined for a particular traffic analysis zone.
Every trip has two ends, and we need to know where both of them are. The first part is determining how many trips originate in a zone and the second part is how many trips are destined for a zone. Because land use can be divided into two broad category (residential and non-residential) we have models that are household based and non-household based (e.g. a function of number of jobs or retail activity).
For the residential side of things, trip generation is thought of as a function of the social and economic attributes of households (households and housing units are very similar measures, but sometimes housing units have no households, and sometimes they contain multiple households, clearly housing units are easier to measure, and those are often used instead for models, it is important to be clear which assumption you are using).
At the level of the traffic analysis zone, the language is that of land uses "producing" or attracting trips, where by assumption trips are "produced" by households and "attracted" to non-households. Production and attractions differ from origins and destinations. Trips are produced by households even when they are returning home (that is, when the household is a destination). Again it is important to be clear what assumptions you are using.
Activities
People engage in activities, these activities are the "purpose" of the trip. Major activities are home, work, shop, school, eating out, socializing, recreating, and serving passengers (picking up and dropping off). There are numerous other activities that people engage on a less than daily or even weekly basis, such as going to the doctor, banking, etc. Often less frequent categories are dropped and lumped into the catchall "Other".
Every trip has two ends, an origin and a destination. Trips are categorized by purposes, the activity undertaken at a destination location.
| Trip Purpose | Males | Females | Total |
|---|---|---|---|
| Work | 4008 | 3691 | 7691 |
| Work related | 1325 | 698 | 2023 |
| Attending school | 495 | 465 | 960 |
| Other school activities | 108 | 134 | 242 |
| Childcare, daycare, after school care | 111 | 115 | 226 |
| Quickstop | 45 | 51 | 96 |
| Shopping | 2972 | 4347 | 7319 |
| Visit friends or relatives | 856 | 1086 | 1942 |
| Personal business | 3174 | 3928 | 7102 |
| Eat meal outside of home | 1465 | 1754 | 3219 |
| Entertainment, recreation, fitness | 1394 | 1399 | 2793 |
| Civic or religious | 307 | 462 | 769 |
| Pick up or drop off passengers | 1612 | 2490 | 4102 |
| With another person at their activities | 64 | 48 | 112 |
| At home activities | 288 | 384 | 672 |
Some observations:
- Men and women behave differently on average, splitting responsibilities within households, and engaging in different activities,
- Most trips are not work trips, though work trips are important because of their peaked nature (and because they tend to be longer in both distance and travel time),
- The vast majority of trips are not people going to (or from) work.
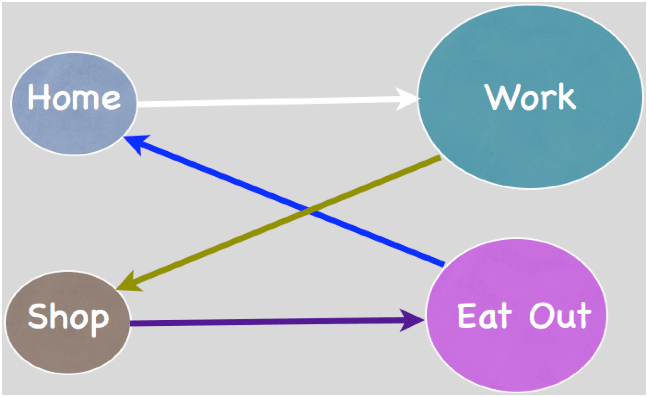
People engage in activities in sequence, and may chain their trips. In the Figure below, the trip-maker is traveling from home to work to shop to eating out and then returning home.
Specifying Models
How do we predict how many trips will be generated by a zone? The number of trips originating from or destined to a purpose in a zone are described by trip rates (a cross-classification by age or demographics is often used) or equations. First, we need to identify what we think the relevant variables are.
Home-end
The total number of trips leaving or returning to homes in a zone may be described as a function of:

Home-End Trips are sometimes functions of:
- Housing Units
- Household Size
- Age
- Income
- Accessibility
- Vehicle Ownership
- Other Home-Based Elements
Work-end
At the work-end of work trips, the number of trips generated might be a function as below:

Work-End Trips are sometimes functions of:
- Jobs
- Area of Workspace
- Occupancy Rate
- Other Job-Related Elements
Shop-end
Similarly shopping trips depend on a number of factors:

Shop-End Trips are sometimes functions of:
- Number of Retail Workers
- Type of Retail Available
- Area of Retail Available
- Location
- Competition
- Other Retail-Related Elements
Input Data
A forecasting activity conducted by planners or economists, such as one based on the concept of economic base analysis, provides aggregate measures of population and activity growth. Land use forecasting distributes forecast changes in activities across traffic zones.
Estimating Models
Which is more accurate: the data or the average? The problem with averages (or aggregates) is that every individual’s trip-making pattern is different.
Home-end
To estimate trip generation at the home end, a cross-classification model can be used. This is basically constructing a table where the rows and columns have different attributes, and each cell in the table shows a predicted number of trips, this is generally derived directly from data.
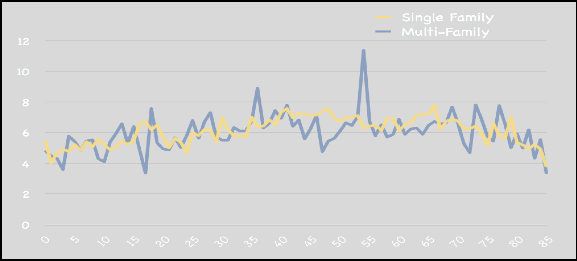
In the example cross-classification model: The dependent variable is trips per person. The independent variables are dwelling type (single or multiple family), household size (1, 2, 3, 4, or 5+ persons per household), and person age.
The figure below shows a typical example of how trips vary by age in both single-family and multi-family residence types.
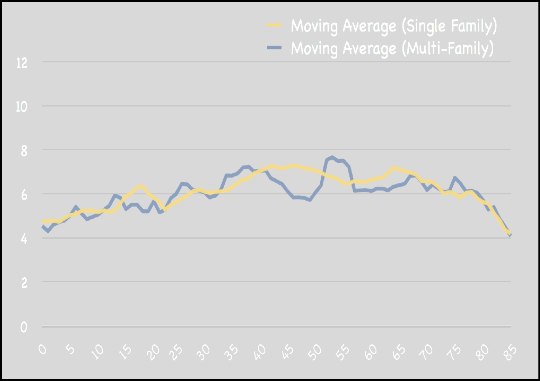
The figure below shows a moving average.
Non-home-end
The trip generation rates for both “work” and “other” trip ends can be developed using Ordinary Least Squares (OLS) regression (a statistical technique for fitting curves to minimize the sum of squared errors (the difference between predicted and actual value) relating trips to employment by type and population characteristics.
The variables used in estimating trip rates for the work-end are Employment in Offices (), Retail (), and Other ()


A typical form of the equation can be expressed as:

Where:
- - Person trips attracted per worker in the ith zone
- - office employment in the ith zone
- - other employment in the ith zone
- - retail employment in the ith zone
- - model coefficients


Normalization
For each trip purpose (e.g. home to work trips), the number of trips originating at home must equal the number of trips destined for work. Two distinct models may give two results. There are several techniques for dealing with this problem. One can either assume one model is correct and adjust the other, or split the difference.
It is necessary to ensure that the total number of trip origins equals the total number of trip destinations, since each trip interchange by definition must have two trip ends.
The rates developed for the home end are assumed to be most accurate,
The basic equation for normalization:

Sample Problems
Variables
- - Person trips originating in Zone i

- - Person Trips destined for Zone j

- - Normalized Person trips originating in Zone i

- - Normalized Person Trips destined for Zone j

- - Person trips generated at home end (typically morning origins, afternoon destinations)

- - Person trips generated at work end (typically afternoon origins, morning destinations)

- - Person trips generated at shop end

- - Number of Households in Zone i

- - office employment in the ith zone

- - retail employment in the ith zone

- - other employment in the ith zone

- - model coefficients

Abbreviations
- H2W - Home to work
- W2H - Work to home
- W2O - Work to other
- O2W - Other to work
- H2O - Home to other
- O2H - Other to home
- O2O - Other to other
- HBO - Home based other (includes H2O, O2H)
- HBW - Home based work (H2W, W2H)
- NHB - Non-home based (O2W, W2O, O2O)
External Exercises
Use the ADAM software at the STREET website and try Assignment #1 to learn how changes in analysis zone characteristics generate additional trips on the network.