De Winter's T waves
Background
- First identified in 2008 by Dr. DeWinter - characteristic pattern in 30 of his 1532-patient database of anterior MI[1]
- 2% of proximal LAD occlusions will have this presentation
- Represents an acute proximal occlusion (unlike Wellen's sign which represents a subacute process)
- Proposed STEMI-equivalent[2]
DeWinter T Waves
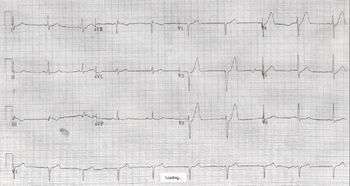
Clinical Features
- Precordial ST-segment depression at the J-point, 1-3 mm
- Tall, peaked, symmetric T waves in the precordial leads
- Lead aVR shows slight ST-segment elevation in most cases
Differential Diagnosis
Peaked T-waves
- MI (hyperacute T waves)
- Hyperkalemia
- Benign Early Repolarization
- De Winter's T waves (acute LAD occlusion)
Management
- Rapid recognition of pattern
- Cath lab activation (education of consultants may be necessary due to unfamiliarity)
Disposition
- Admit
See Also
External Links
References
- de Winter R, et al. A new ECG sign of proximal LAD occlusion. NEJM. 2008; 359:2071–2073.
- Rokos I, et al. Appropriate cardiac cath lab activation: optimizing electrocardiogram interpretation and clinical decision-making for acute ST-elevation myocardial infarction. Am Heart J. 2010;160:995–1003.
This article is issued from
Wikem.
The text is licensed under Creative
Commons - Attribution - Sharealike.
Additional terms may apply for the media files.