PowerPoint 2003
Adding Charts, Diagrams, and Tables
Inserting a diagram or organization chart
Does your presentation require a diagram or organization chart? An organization chart shows hierarchal relationships in a company or organization such as president and vice president, while diagrams are used to show relationships between various elements.
To insert a diagram or organization chart:
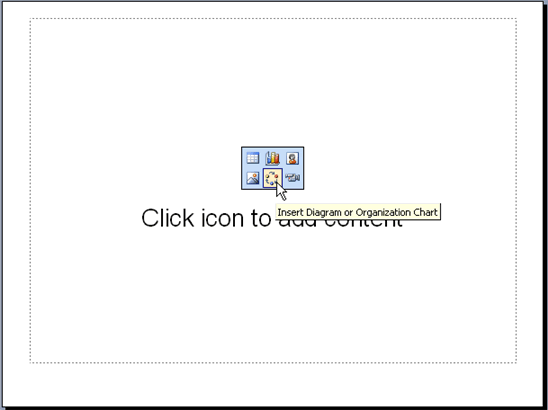
- Insert a new slide with a Diagram or Organization Chart icon.
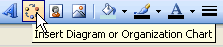
- Click the Insert Diagram or Organization Chart icon.
- When the Diagram Gallery dialog box appears, select a diagram or chart type.
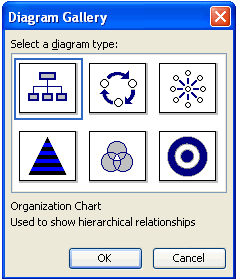
- Click OK.
OR
- If working in a blank slide, click the Insert Diagram or Organization Chart button on the Drawing toolbar.